
Sydneysiders have endured a very humid beginning to the year, which is likely influencing energy demand across the city.
During the first 20 days of January, Sydney Observatory Hill’s mean 9am and 3pm relative humidity was 84% and 73% respectively.
This year’s humidity has been well above the historical average. The mean January relative humidity between 1991 and 2020 at 9am is 71%, while the 3pm mean is 60%.


Image: Average daily relative humidity in January at 9am (top) and 3pm (bottom), Source:BOM
The highest dewpoint in Sydney in January so far was 24.3C°C, which is equivalent to Darwin’s 9am and 3pm average January dewpoint.
The dewpoint is the temperature to which air must be cooled to achieve a relative humidity of 100% or saturation of moisture in the atmosphere. The higher the dewpoint, the greater the amount of moisture in the atmosphere, which makes it more difficult to cool down through the evaporation of sweat.
For example, this is how different dew point temperatures would make you feel if you were accustomed to Australia’s sub-tropical climate:
- >24ºC – Oppressive, uncomfortable for most, possible heat stress issues
- 20-24ºC – Muggy and quite uncomfortable
- 15-20ºC – Starting to feel muggy, though still comfortable for most
- 10-15ºC – Comfortable
- 5-10ºC – Dry
- < 5ºC – Very dry
Sydney’s humid and sticky weather has unfortunately combined with warm days and nights, adding to the discomfort, and bringing many days of rain and thunderstorms to the state.
So far this January, the average overnight temperature is 20.8ºC, while the average maximum temperature was 27.4ºC, s, both about 2ºC above normal.
What is behind this humid weather?
La Niña has helped drive this humid airmass towards Australia, with warmer than average oceans across the western equatorial Pacific Ocean.
The East Australian Current (EAC) has been dragging this warmth south, with the water temperature off Sydney’s coast a warm 24 degrees on Friday. The warm oceans across northern and eastern Australia are injecting moisture into the atmosphere, with increased evaporation.
Prevailing easterly winds are helping drag the warm and humid airmass over the east coast of Australia, bringing days of unforgiving humidity.
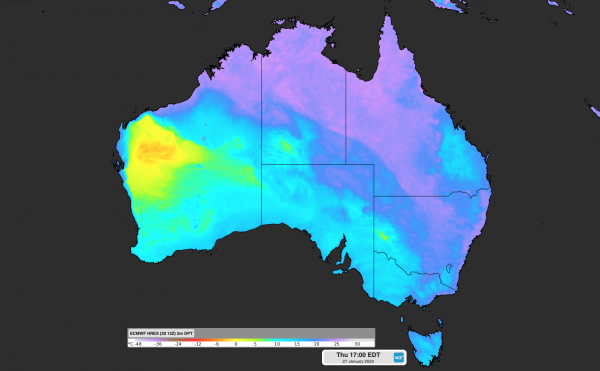
The map below shows high dewpoints across northern and eastern Australia on Friday, January 28.

Image: ECMWF forecast 2m dew point temperature at 5pm AEDT on Thursday, January 27.
While cool southerly winds have provided some relief to Sydneysiders this week, higher air temperatures and dewpoint temperatures are forecast to return next week.

Image: Forecast air temperature and dew point temperature in Sydney during the next 7 days.
La Niña is at or near its peak and is expected to return to neutral levels by early Autumn.
How is this humidity impacting electricity demand in NSW?
The relentless humidity is likely increasing energy demand across Sydney this month, with many needing to turn their air conditioners on.
Both humidity and temperature play a critical role in energy demand forecasting and accurate forecasts are paramount to market operators.
Weatherzone provides our energy and market operator clients with humidity forecasts and profiles throughout the day. For more information, please contact us at apac.sales@dtn.com.




