Earlier this year destructive thunderstorms and winds equivalent to a category two cyclone lashed Victoria, bending towers and toppling trees and poles. So, how can thunderstorms damage energy infrastructure, and are these events getting worse?
This event occurred during mid-February 2024, when a strong cold front generated severe thunderstorms and localised wind gusts of 130km/h after a prolonged period of extreme heat. The image below shows a squall line around 1,500km long causing lightning across four states in February.
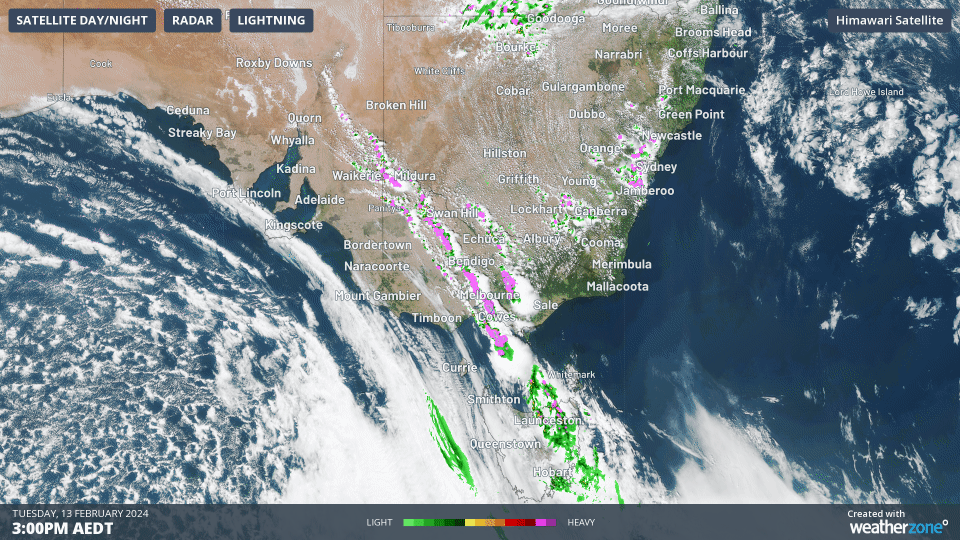
Image: Himawari-9 satellite image, lightning and radar on Tuesday, February 13 at 3pm AEDT.
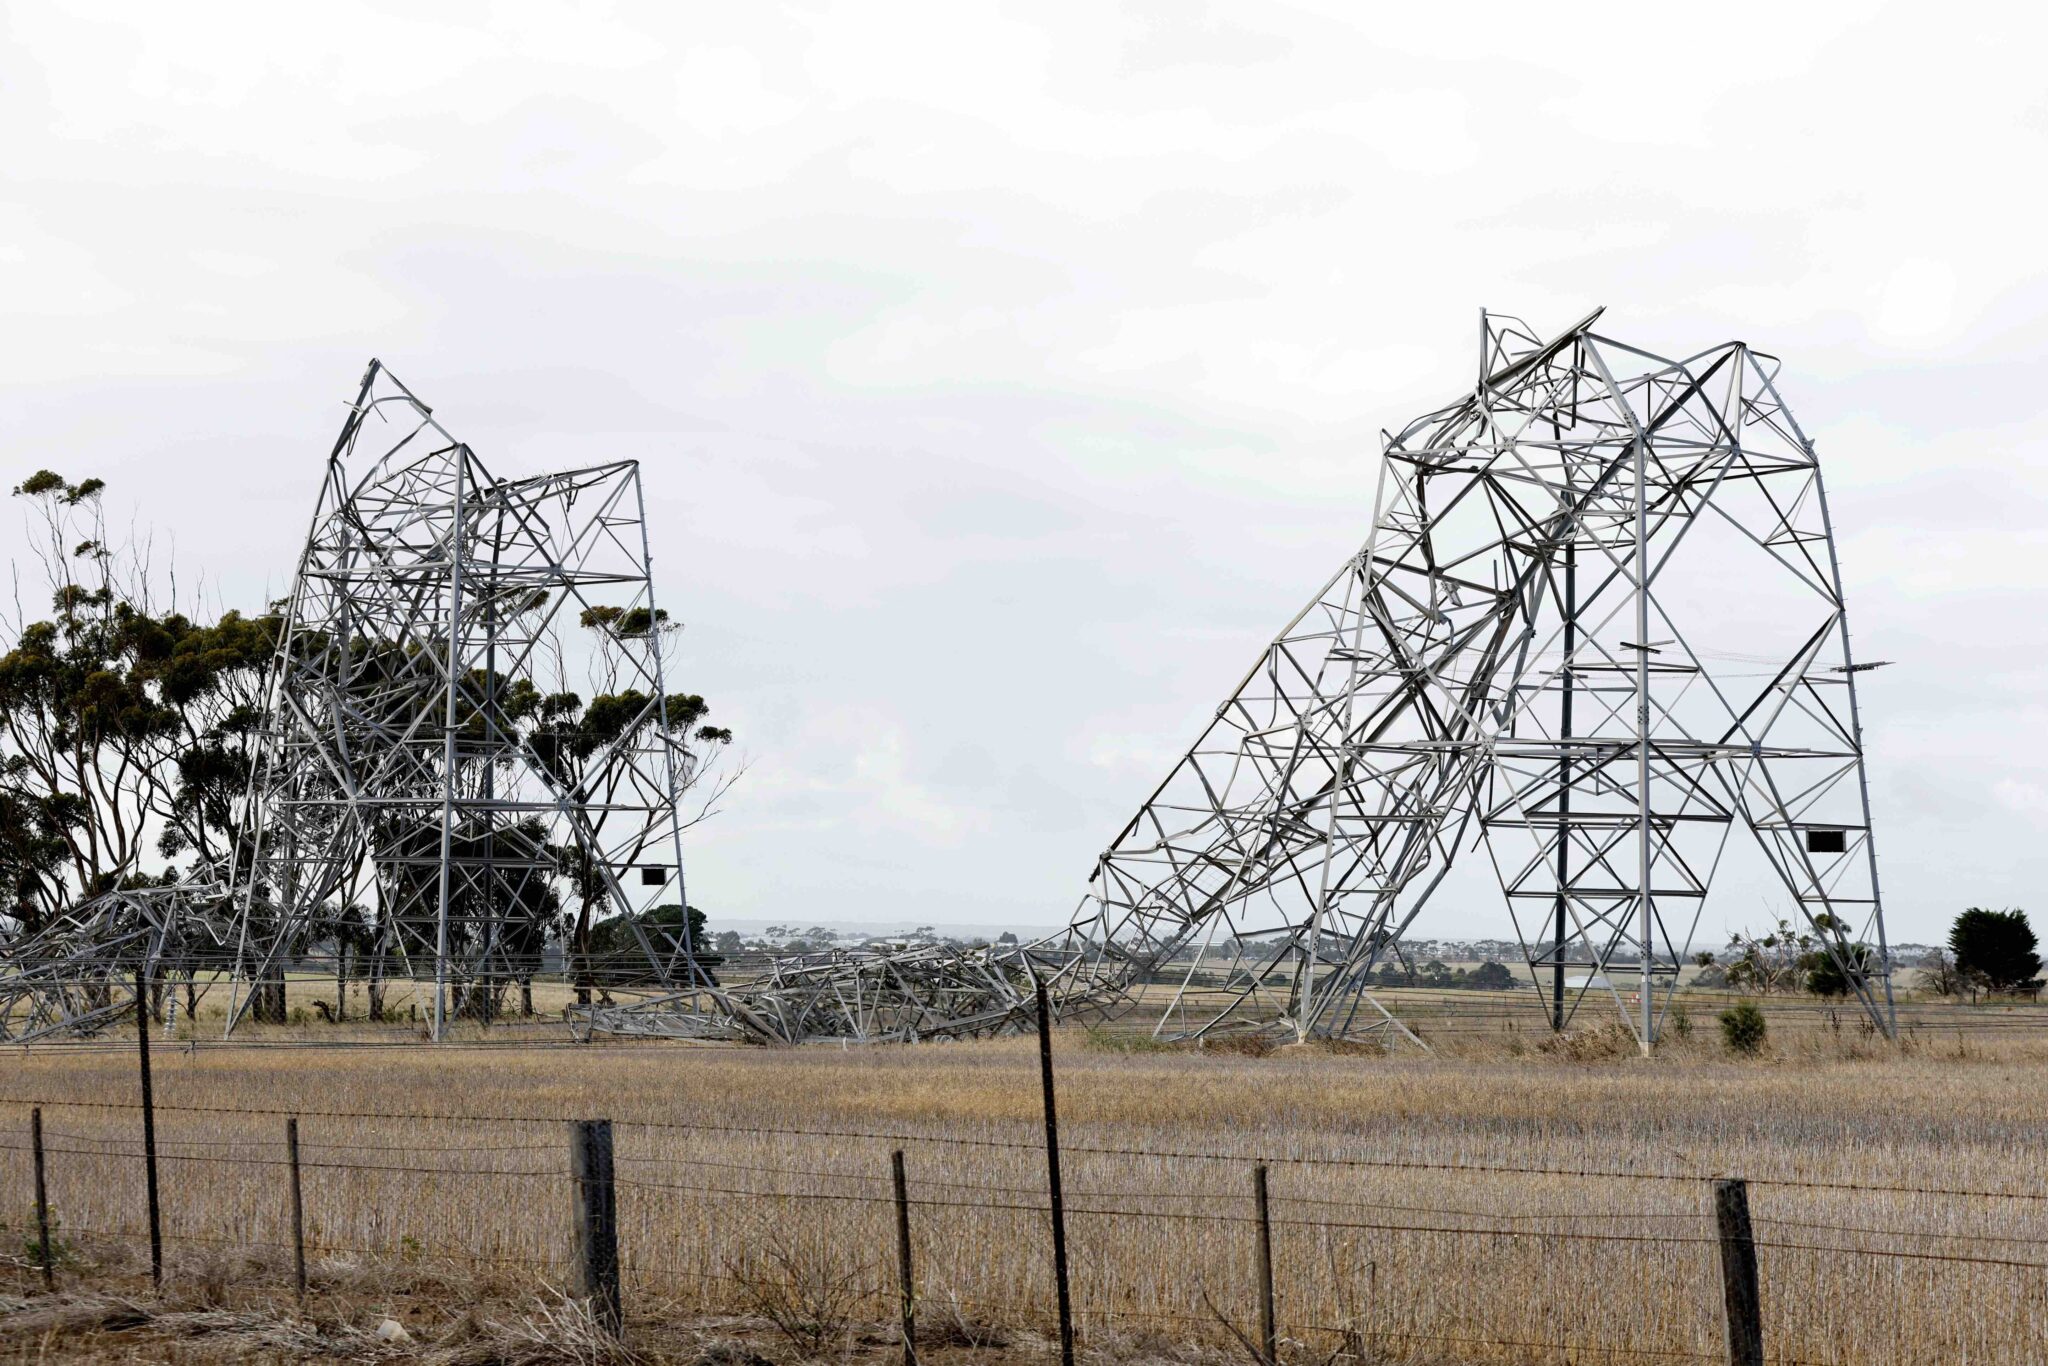
The destructive winds were caused by microbursts, which bent towers and toppled trees and poles in Vic, leaving thousands without power.

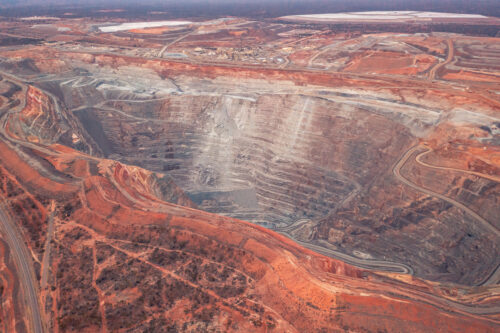
Image: Damaged transmission towers at Anakie, Source: AAP
Microbursts are a localised column of sinking air (downdraft) within a thunderstorm and is usually less than 4km wide. The cold, heavy air within this downdraft descends rapidly to the surface and then spreads out in all directions as it hits the ground. The image below shows how wind gusts are produced in thunderstorms.
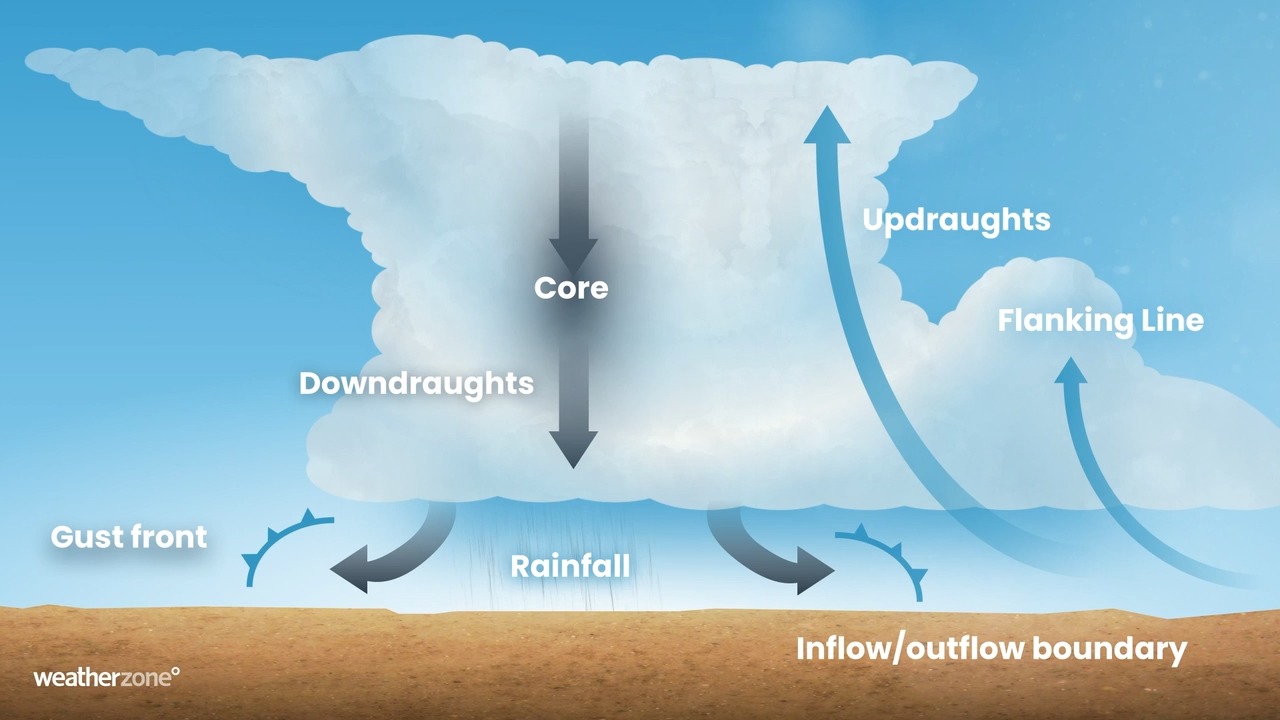
Microbursts can be destructive and cause wind gusts above 100 km/h, which can be a risk for power infrastructure. The force applied to the structure is roughly proportional to the speed squared.
Fierce wind gusts from thunderstorms can:
- Knock down trees, which can fall onto power lines
- Topple poles
- Knock out transmission towers.
Microbursts typically occur during the warmer months of the year and, unfortunately, they can develop rapidly and last for only a short period of time, making them difficult to predict and warn communities about.
Have these thunderstorm events become more severe in Victoria?
The severe thunderstorm season across southern Australia occurs during the warmer months of the year, between November and April.
While thunderstorms are more common across northern Australia, Qld, and NSW, they do occur frequently in the summer months. The map below shows the annual average lightning density in Vic between July 2014 and June 2023, with the most lightning occurring in the northeast high country each year.
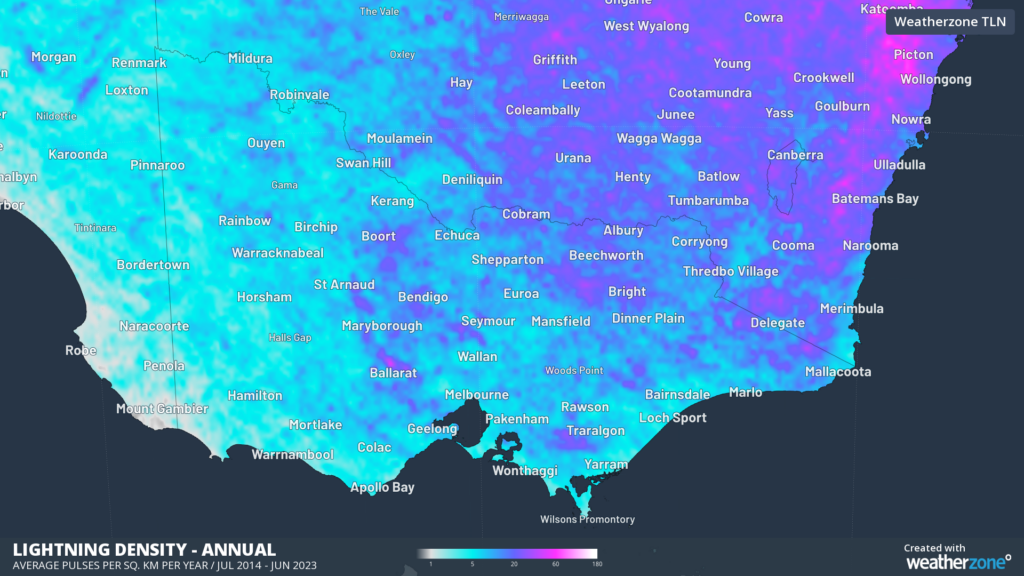
Image: Total Lightning Network Annual lightning density mean between July 2014 and June 2023.
You can see in the map above that lightning is common to the north of Ballarat near Learmonth and Miners Rest, with the region seeing 37.7 pulses per year. The high country near Benalla and Whitfield recorded an average of 28.1 pulses, Thorpdale in Gippsland saw 24.5 pulses, and Melbourne only 8.2 pulses per year.
Research has shown that the warming climate is increasing the risk of heatwaves and bushfires, which can impact energy infrastructure. Unfortunately, it is unknown how global warming will affect thunderstorms and their associated destructive winds. To research climate change’s impact on thunderstorms, we would need quality data that dates back well into history. Unfortunately, detecting lightning is a fairly new phenomena, so a solid climate base to compare data to is not currently existent.
According to the University of Melbourne researchers and Watt Clarity, ‘The evidence we do have suggests continued climate change may potentially increase the risk of extreme winds from thunderstorms. This is partly due to more moist and unstable air, which are essential for thunderstorms to form. We think these conditions could occur more often with climate change, in part because warmer air can hold more moisture.’
Indeed, much of Australia had an unusually stormy summer 2023/24, with Melbourne, Canberra and Brisbane all seeing 5 to 6 extra storm days a season. The map below shows that an unusually high number of thunder days were seen over most of Qld, NSW, SA, Vic, the ACT and Tas during the summer of 2023/24 compared to the average of the most recent nine years.
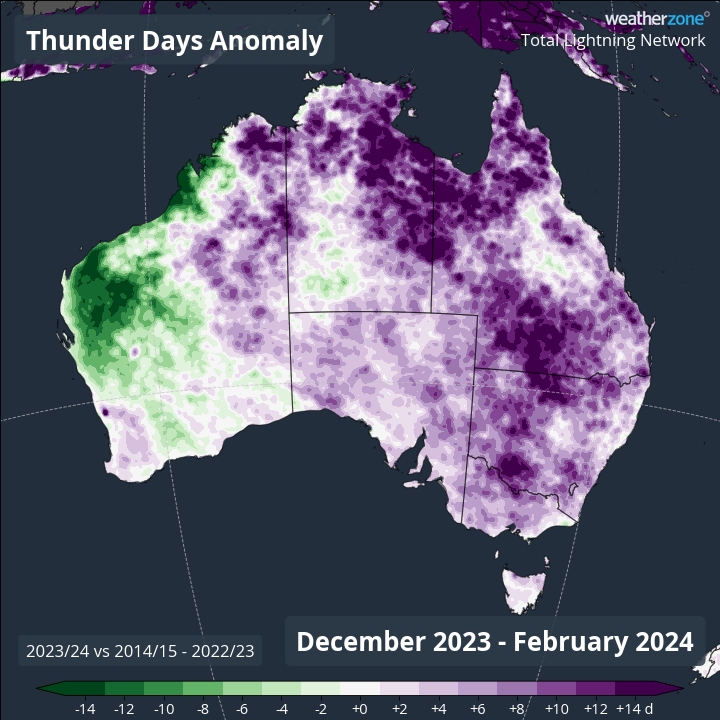
Image: Thunder day anomalies for summer 2023-24 versus the average thunder days for the nation’s nine most recent summers (2014/15 to 2022/23).
Are you safeguarding your utilities assets and personnel from the threat of increasingly volatile weather?
DTN APAC, a DTN company, offers precise weather intelligence and alerting to protect your utilities network when severe weather, floods and fires threaten.
Over 80% of Australian transmission and distribution networks already rely on our proven nowcasting and forecasting out to 15 days. You can rest assured yours is protected by market-leading analysis. With this foresight you can gain lead time to prepare for possible outages, reduce risk and protect your people and profits.
You will never be left in the dark when conditions suddenly worsen. We deliver reliable, up-to-the-minute weather forecasts and analytical tools that give you the power to enhance your operational management and response to weather risk. Our Total Lightning Network is a globally proven solution that accurately identifies and alerts you to lightning strikes within your defined thresholds, supporting the safety of your team.
Your customisable interface has GIS mapping, showing multiple weather layers over your utilities network and offering full situational awareness. You can quickly recognise any threat to your assets in real time. 24-hour asset monitoring allows you to track lightning, bushfires and other severe weather systems that approach your service territory.
Advanced and actionable analytics allow you to act decisively and improve your planning and outage response strategy. Keep the power on this season with Storm Impact Analytics;
- Understand potential outage risk
- Learn from past events and provide accurate restoration timelines for customers
- Restore power faster by managing response teams
- Gain powerful decision-making support
Utilities that have installed Storm Impact Analytics have reported a 39% increase in customer satisfaction, for more information, please contact us at apac.sales@dtn.com.