
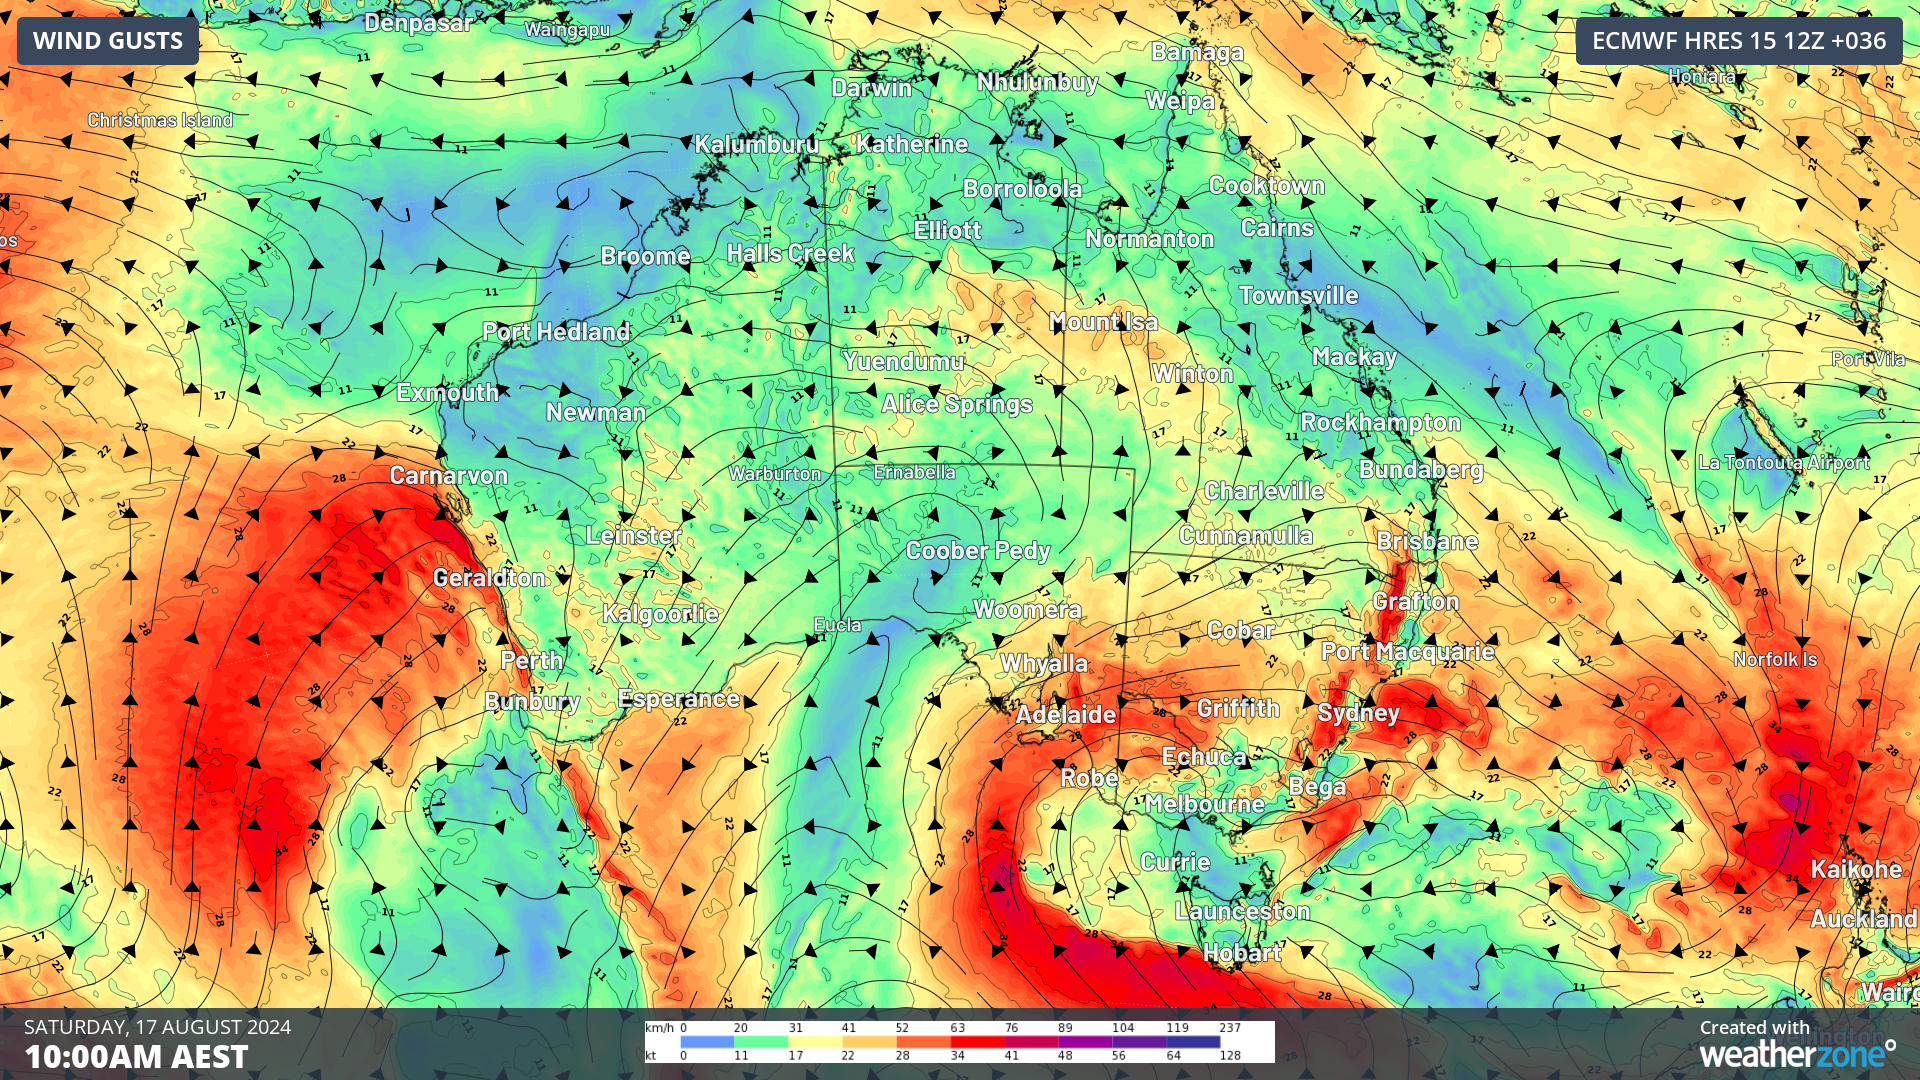
A decent week of wind power is ahead as several lows, and cold fronts sweep across southern Australia.
The latest Mean Sea Level Pressure map below shows a low pressure system in the Bight, while a cold front is approaching the west coast of WA.
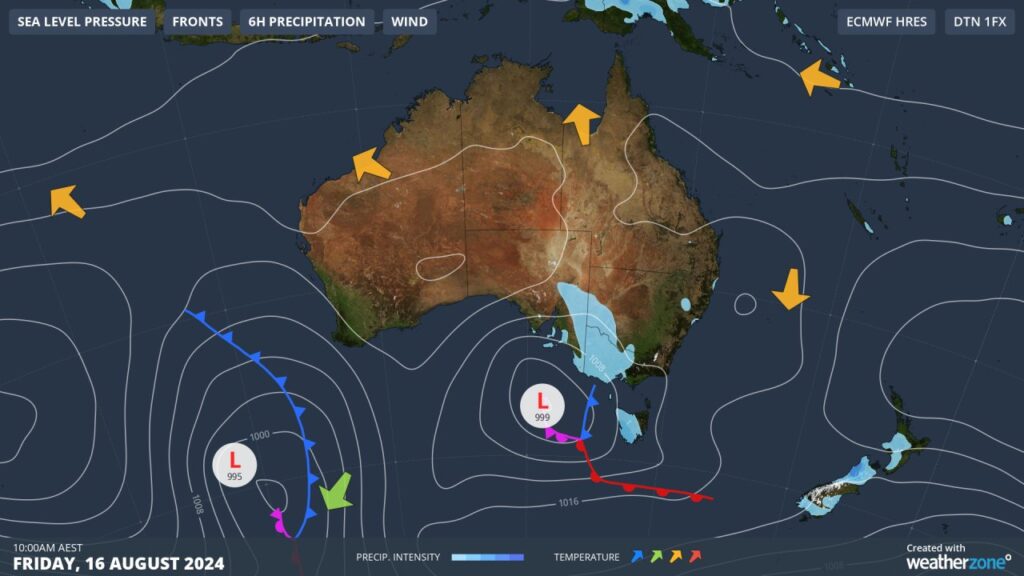
Image: Mean Sea Level Pressure (MSLP) chart at 10am on Friday, August 16.
The low pressure system in the Bight will bring decent wind power in the coming days to southeastern Australia as it moves slowly east. Meanwhile the cold front to the southwest of WA will elevate wind power in the region on the weekend, before it sets its sights on the southeastern states. Yet, another front is also forecast to impact southern Australia during the middle of next week.
The image below shows periods of strong wind gusts are forecast in the coming week across much of Australia, in response to these low-pressure systems and fronts.
Image: Instantaneous wind gust forecast for a week leading up to Saturday, August 24, according to ECMWF
The front during the middle of next week looks like the strongest with decent wind power forecast for at least four days as it passes through.
Image: Weatherzone’s National Electricity Market (NEM) wind farm output forecast for the next 7 days
This windy week comes in response the recent Sudden Stratospheric Warming event which caused the Southern Annular Mode (SAM) to dip into a negative phase. You can see in the image below that negative SAM is forecast to continue for the remainder of August into spring.
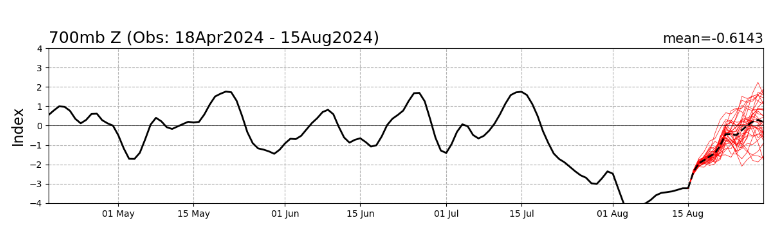
Image: Southern Annular Mode (SAM) observations (solid black line), forecast mean (dotted black line) and Ensemble members forecasts (red lines) showing a strongly negative SAM. Source: NOAA CPC
The SAM is simply an index that’s used to monitor the position of a belt of westerly winds that flow from west to east between Australia and Antarctica.
When the SAM is in a negative phase, these westerly winds, and the cold fronts and low pressure systems they carry, are located further north than usual for that time of year.
Negative phases of the SAM during winter and spring often:
- Increase rainfall over southwestern and southeastern Australia
- Reduce rain in parts of eastern Australia
- Cause stronger westerly winds in southern Australia
This means that we could see elevated wind power in the coming month or two in response to this phase of negative SAM.
Do you want a solution that makes scheduling maintenance on your wind farm easier?
DTN APAC delivers industry-leading weather and power generation forecasting and real-time alerting to inform your critical decision-making. Together we can keep your staff and assets safe, and efficiency high.
With lightning strikes, severe weather, flood and fire posing risk to wind farms across Australia, we have tailored solutions that can significantly improve your oversight and response.
Total Lightning Network comprises of regional and global sensors to detect intra-cloud (IC) and cloud-to-ground lightning (CG) strikes within your proximity thresholds. It provides unparalled detection accuracy (<200m) and real-time lightning alerts to any device across your operations team.
Your customizable Energyzone interface and Weatherguard app will provide access to the Total Lightning Network as well as centralized data from state and territory fire agencies, the Bureau of Meteorology, and over 30 national and international private and state organisations. This enables full situational awareness of weather conditions and fire risk, as well as severe weather alerting via text, email and phone call, so your staff can respond effectively when required. To find out more visit our contact page or email us at apac.sales@dtn.com.




