
Multiple flooding events have occurred in Queensland since the start of 2025, but why?
Last month was Australia’s hottest and 4th-wettest March on record. Queensland was especially wet, registering its 3rd wettest March on record. This moisture combined with the very warm temperatures around the country to bring the warmest March minimum temperatures on record for Queensland, averaging 2.66°C above the long-term average. But why was Queensland so wet in March?
The state of the Pacific Ocean
The Bureau of Meteorology kept the El Niño Southern Oscillation (ENSO) dial in the neutral phase over the past summer, however the equatorial Pacific Ocean showed signs of La Niña at times. As seen in the image below, cooler than average sea surface temperatures have featured over the central equatorial Pacific Ocean, in a region called the Niño3.4.

Image: Loop of Sea Surface Temperatures across the Pacific Ocean over the past 3 months. Source: NOAA.
The coldest sea surface temperature over the region can be seen during January and February, before a surge of more moderate temperatures moves in from the east. The figure below shows the evolution of the Niño3.4 Sea Surface Temperature Index. The index can be seen briefly dropping below -0.8°C around late 2024 and early 2025, around the time the central equatorial Pacific Ocean sea surface temperatures were the coldest.
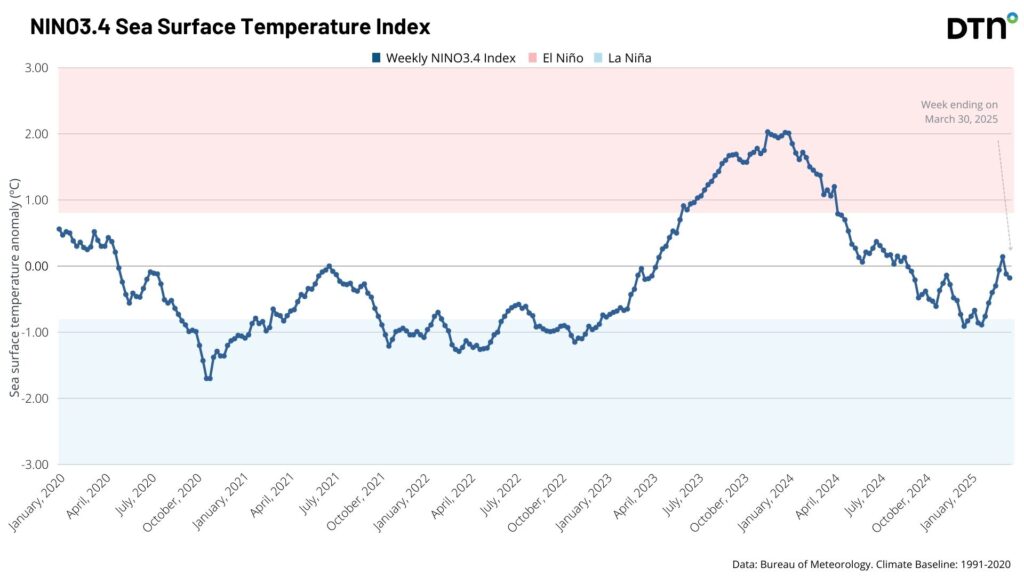
Image: Niño3.4 Sea Surface Temperature Index over the past 5 years.
Conditions across the central Pacific Ocean were enough for the US’s Climate Prediction Center (CPC) to declare it a La Niña event in early January. The US’s CPC has a weaker threshold of -0.5°C compared to the -0.8°C threshold used by the Bureau of Meteorology (BoM) in Australia, along with atmospheric response thresholds.
This La Niña like pattern has mostly affected Queensland with very wet conditions in the past few months, as seen in the rainfall analysis for March 2025 below.
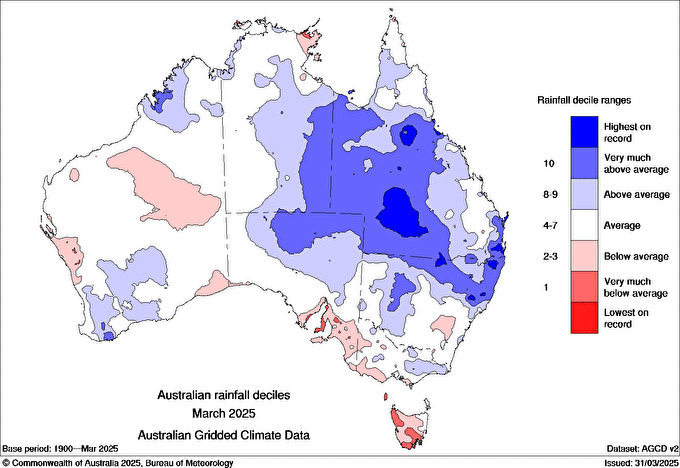
Image: Rainfall deciles across Australia for March 2025. Source: Bureau of Meteorology.
The widespread above average rainfall across northern and outback Queensland is similar to that of March 2018, as seen in the image below. The 2017-18 season featured a weak and delayed La Niña event.
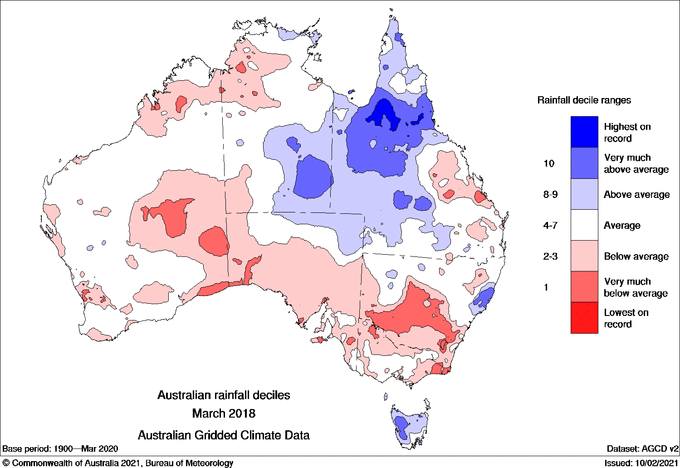
Image: Rainfall deciles across Australia for March 2018. Source: Bureau of Meteorology.
Record warm sea surface temperatures and other considerations
While the ENSO phases might have been similar in 2017-18 and 2024-25, ocean temperatures closer to Australia have been at record warm levels over the past few months. This led to enhanced moisture in the atmosphere, helping fuel all the heavy rain events across Queensland.
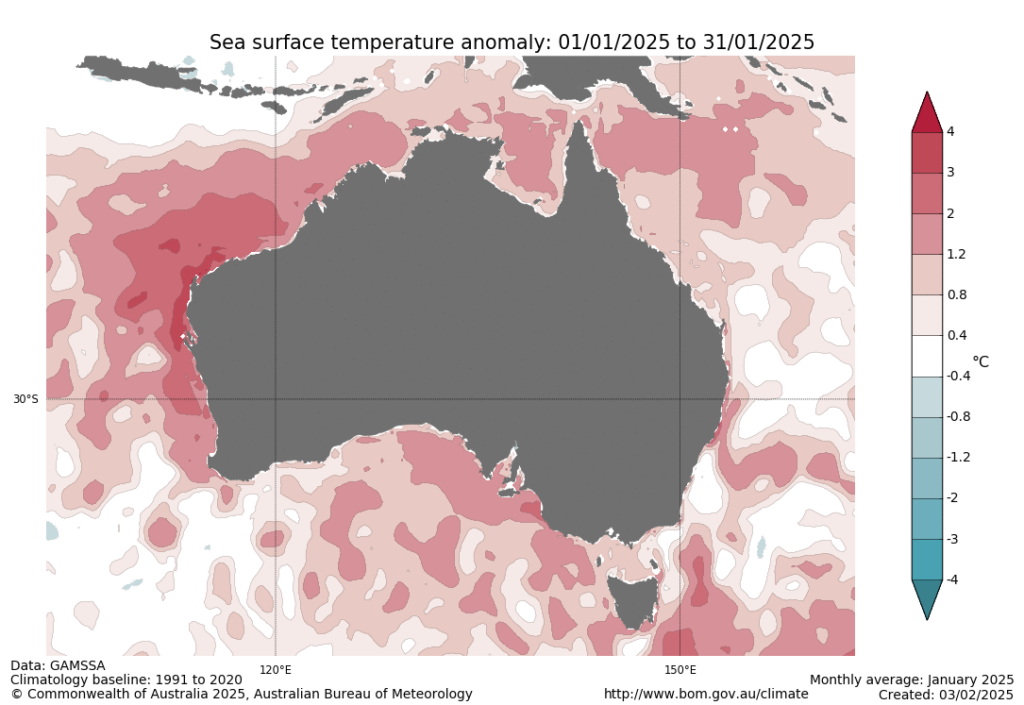
Image: Sea surface temperature anomalies around Australia in January. Source: Bureau of Meteorology.
Some other notable features to impact Queensland this month included Tropical Cyclone Alfred, which brought 275mm in 24 hours to Brisbane, marking the city’s wettest day in half a century. A monsoonal burst and an active Madden-Julian Oscillation over the second half of the month harnessed the available moisture around Queensland bringing intense rainfall to the north, and then over the state’s outback.
Outlook for ENSO and winter
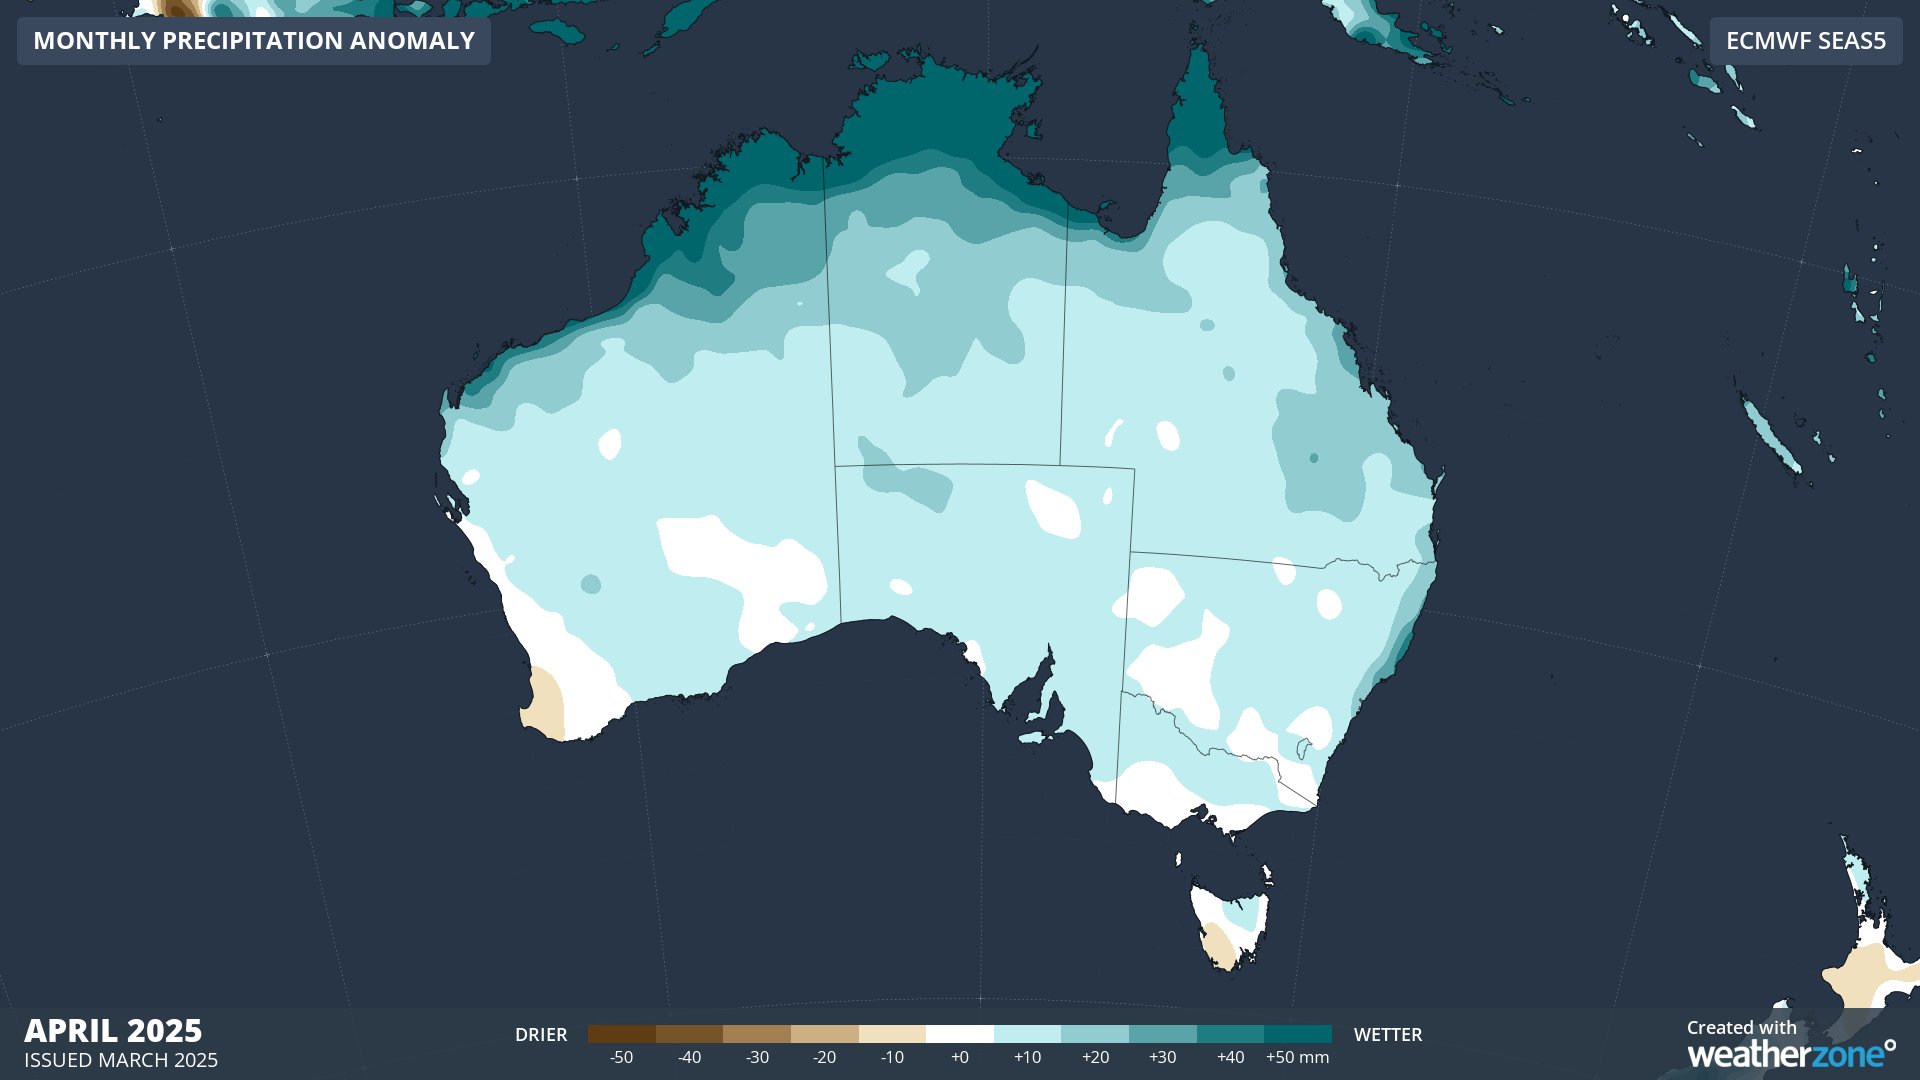
Even by the US’s definitions of ENSO, the current La Niña event will not last much longer, as seen by the Niño3.4 index returning closer to a true neutral phase in recent weeks. Current consensus across global models favours the neutral phase of the ENSO to remain over the coming winter. However, sea surface temperatures around Australia and the globe are likely to remain very warm, promoting above average rainfall over eastern Australia, as can be seen in the forecast maps below for April and May.
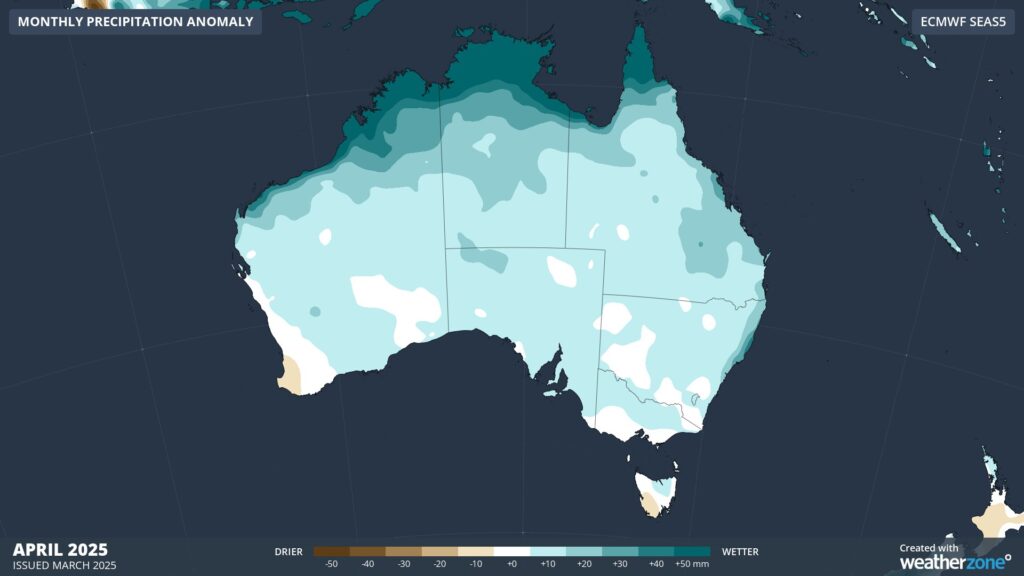
Image: Forecast rainfall anomalies for April.
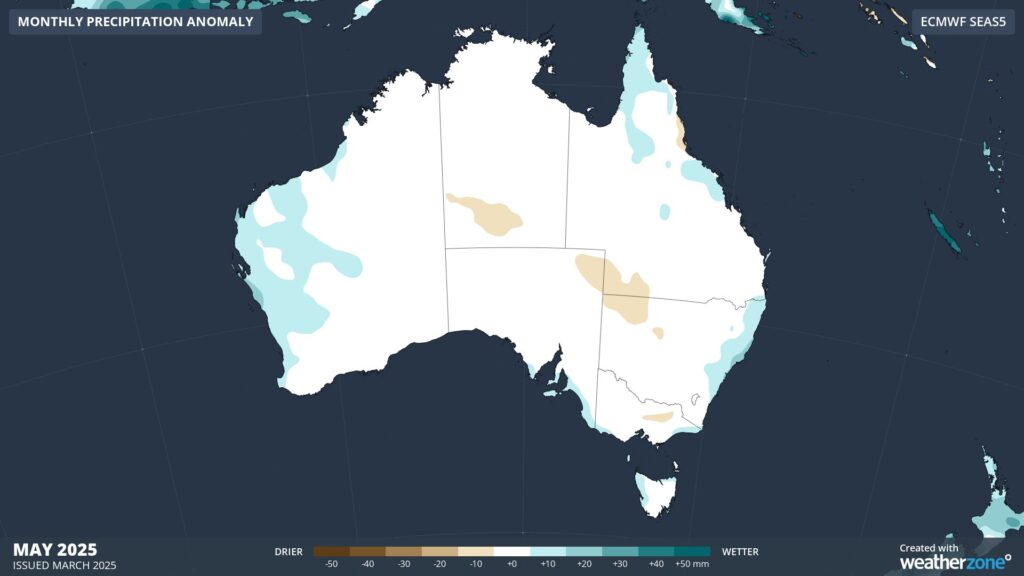
Image: Forecast rainfall anomalies for May.
How DTN APAC can help
The shifting climate is bringing increased complexity and greater risks to businesses worldwide. We are here for you, delivering trusted weather solutions to optimize your operations and profitability.
DTN APAC is a diverse team, with global forecasting, product development and analytics expertise. Couple this with extensive industry experience spanning Aviation to Energy, and we are primed to assist you in strengthening your response to weather impact.
We work hard to identify your operational pressures and tailor our services and products to meet your needs. Concise communication, giving you full situational awareness exactly when you need it, is our focus. We want to reduce weather risk in your operations, every day.
We deliver clear and comprehensive weather data, personalised risk assessments and briefings to you and your team, so that your critical decisions can be made with confidence.
We are available 365 days a year, so you always have the timely guidance you require, especially when severe conditions hit.
You have our insights to rely on to see you through complex situations, minimising potential loss of profit and maximising the safety of your staff and assets. To find out more about large range of products and services contact us at sales.apac@dtn.com




