

A negative Indian Ocean Dipole (IOD) event is now underway, increasing the likelihood of above average rain over large parts of Australia in the coming months.
What is the Indian Ocean Dipole (IOD)?
The IOD is an index used to monitor sea surface temperatures across the tropical Indian Ocean. It’s an important index for the Australian region because it can have a strong influence on weather patterns across the country.
The IOD index measures the difference between sea surface temperature anomalies on the western and eastern sides of the tropical Indian Ocean.
A negative IOD occurs when we see cooler than average sea surface temperatures in the western tropical Indian Ocean, near the Horn of Africa, and abnormally warm water sits in the eastern tropical Indian Ocean, near Indonesia. You can see a clear example of this negative IOD pattern in the image below.
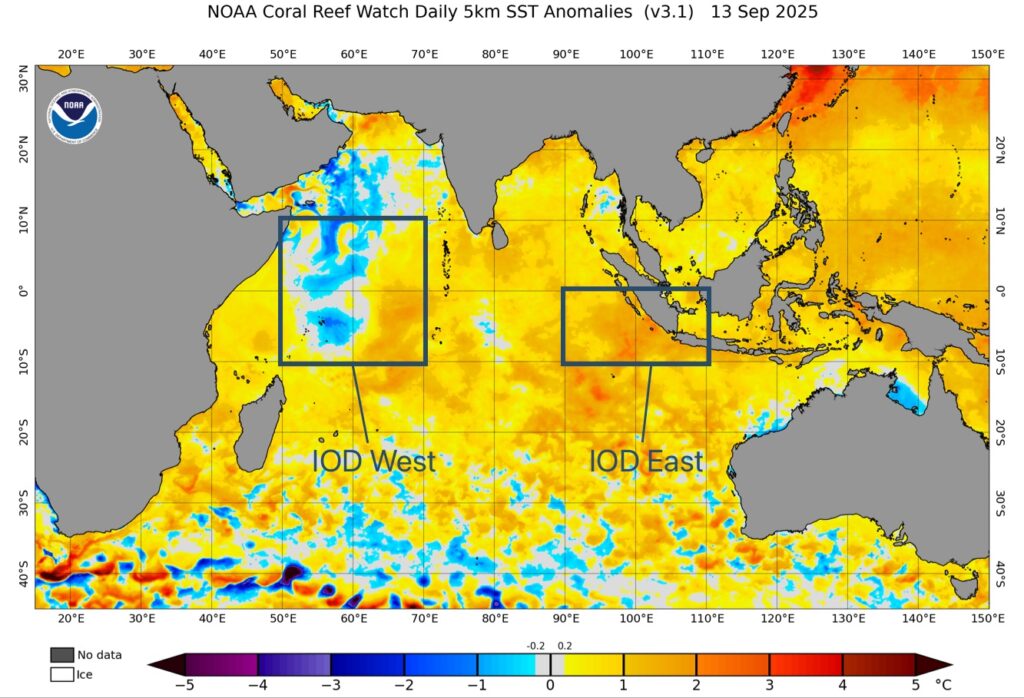
Image: Sea surface temperature anomalies over the Indian Ocean on September 13, 2025, showing a clear negative IOD pattern with cooler than average water in the IOD West region and warmer than average water in the IOD East region. Source: NOAA
When a negative IOD is occurring, westerly winds become enhanced across the tropical Indian Ocean, which forces moisture-laden air to flow over Australia from the northwest. This injection of tropical moisture can link up with cold fronts and low pressure troughs crossing Australia to produce large bands of rain and cloud.
When a negative IOD is in place, we usually see above average rain and thunderstorm activity over large areas of Australia, along with changes to daytime and nighttime temperature regimes across the country – some areas see abnormally cool conditions and other areas experience relative warmth.
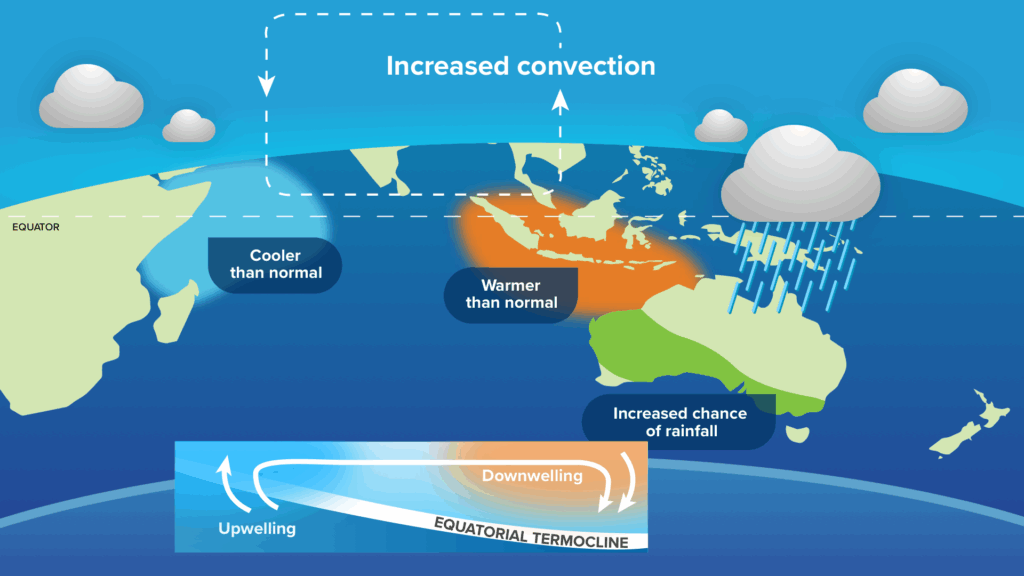
Image: Typical oceanic and atmospheric patterns during a negative IOD.
What is the IOD doing now?
The IOD index has been below zero since the start of July and has remained below the negative IOD threshold of -0.4°C since late July. For a negative IOD to officially be declared, the index needs to stay below -0.4°C for at least eight consecutive weeks.
The latest weekly IOD index value was -1.17°C, measured during the week ending on September 14. This was the eighth consecutive week below the negative IOD threshold of -0.4°C, which means this can now be officially classified as a negative IOD event.
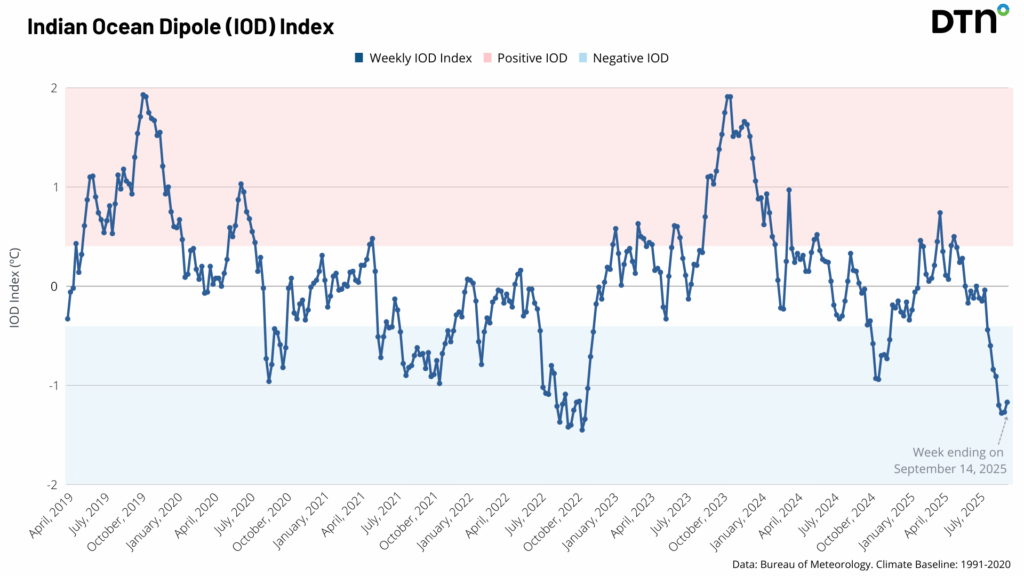
Image: Weekly Indian Ocean Dipole (IOD) index between 2019 and 2025.
This is the first negative IOD event since 2022. Forecast models suggest that this negative IOD event will persist through the remainder of spring and possibly into the beginning of summer.
While no two negative IOD events are the same, they usually have similar impacts on rainfall and temperature across Australia.
Rainfall
Large areas of Australia typically see above average rainfall when a negative IOD is in place. Because the moisture associated with the IOD comes from the northwest, areas on and west of the Great Dividing Range are more susceptible to the rain it brings. Some areas along the country’s east coast don’t see much of a boost in rainfall when a negative IOD is underway.
One area that can see below average rain from a negative IOD is the southwest of WA, largely because the feed of moisture coming from the tropical Indian Ocean passes to far north and east to impact this part of the country.
The map below shows how a negative IOD typically impacts rainfall distribution across Australia between September and November.
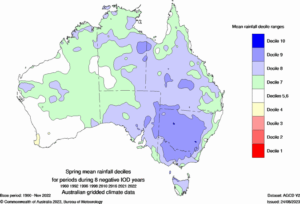
Image: Observed mean rainfall deciles during spring (September to November), averaged over eight moderate to strong negative IOD events combined. Source: Bureau of Meteorology.
Increased frequency and intensity of cloudbands streaming into southeastern Australia bring enhanced potential for widespread flooding disrupting road, rail and aviation transport industries between South Australia, Victoria and NSW.
Maximum temperature
The increased cloud cover and rainfall associated with a negative IOD can have a big impact on temperatures across Australia, and subsequently, energy demand as southeastern Australia ramps up into it’s warmest months. The increased cloud cover also decreased solar energy production, requiring energy suppliers to rely more strongly on other energy production sources.
Large areas of southern, central and southeastern Australia typically experience below average daytime maximum temperatures during a negative IOD, particularly across the Murray Darling Basin.
By contrast, daytime temperatures are often warmer than normal in northern Australia when a negative IOD is in place during this time of year due to the proximity to warmer waters.
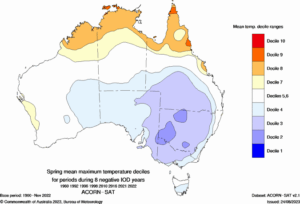
Image: Observed mean maximum temperature deciles during spring (September to November), averaged over eight moderate to strong negative IOD events combined. Source: Bureau of Meteorology.
Minimum temperature
Australia’s springtime minimum temperatures are also affected by the IOD. Nights are typically warmer than average across far northern Australia and parts of the east. By contrast, minimum temperatures are often near to slightly below average across large areas of southern and central Australia.
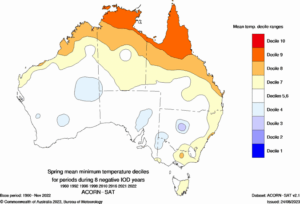
Image: Observed mean minimum temperature deciles during spring (September to November), averaged over eight moderate to strong negative IOD events combined. Source: Bureau of Meteorology.
The influence a negative IOD has on suppressing temperatures and increasing rainfall often helps to reduce bushfire activity over most of Australia during spring.
It’s important to note that the IOD is not the only climate driver that influences Australia’s weather on a seasonal timescale. The impact of the IOD can be enhanced or suppressed by other climate drivers, including La Niña, El Niño and the Southern Annular Mode.
How DTN APAC can help
The shifting climate is bringing increased complexity and greater risks to businesses worldwide. We are here for you, delivering trusted weather solutions to optimize your operations and profitability.
DTN APAC is a diverse team, with global forecasting, product development and analytics expertise. Couple this with extensive industry experience spanning Aviation to Energy, and we are primed to assist you in strengthening your response to weather impact.
We work hard to identify your operational pressures and tailor our services and products to meet your needs. Concise communication, giving you full situational awareness exactly when you need it, is our focus. We want to reduce weather risk in your operations, every day.
We deliver clear and comprehensive weather data that you can’t get anywhere else, personalised risk assessments and briefings to you and your team, so that your critical decisions can be made with confidence.
We are available 365 days a year, so you always have the timely guidance you require, especially when severe conditions hit.
You have our insights to rely on to see you through complex situations, minimising potential loss of profit and maximising the safety of your staff and assets.
Learn more about our large range of industry leading products and services or email us at sales.apac@dtn.com




