
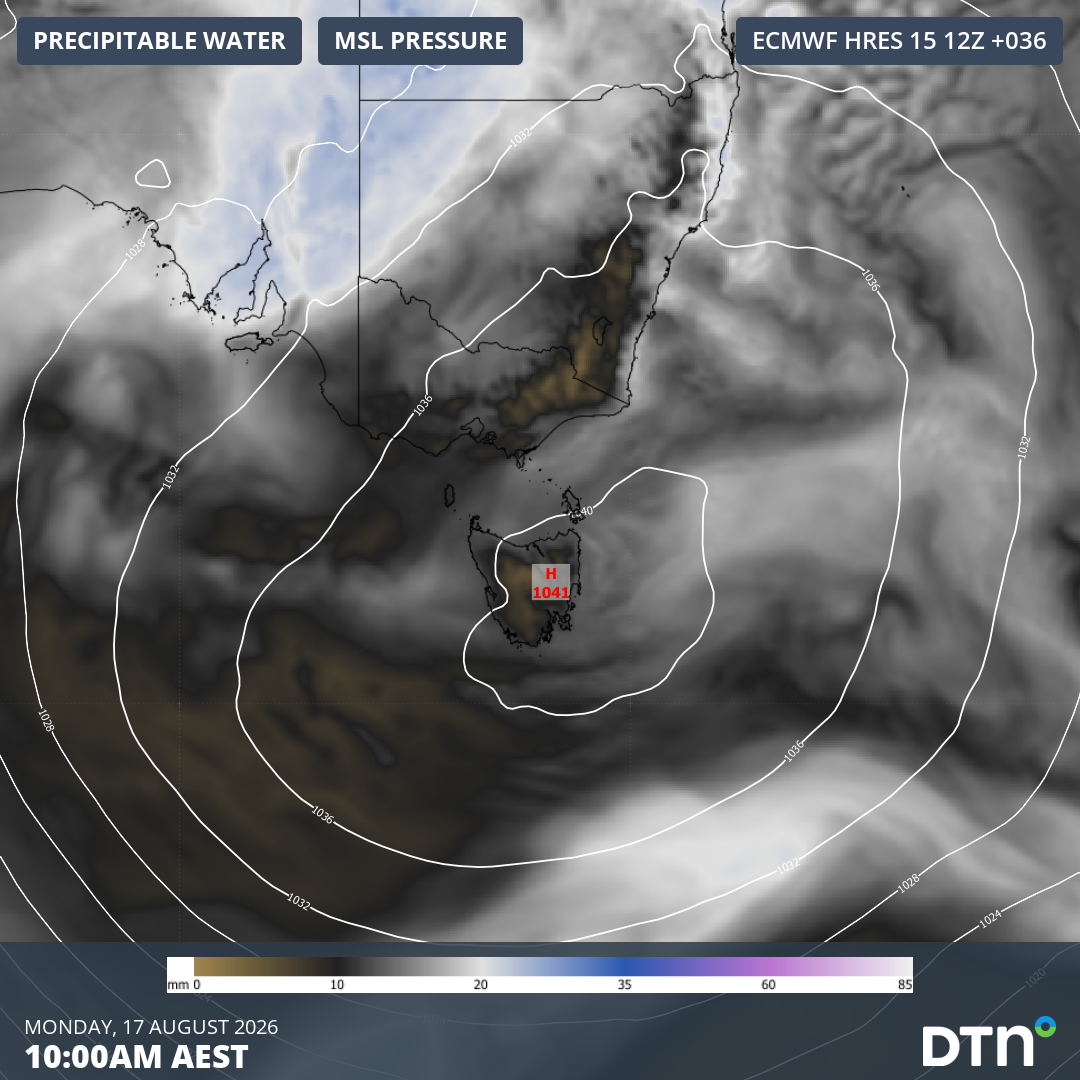
A very strong high pressure system centred over Tasmania will impact southern and eastern Australia’s weather over the coming days.
How strong is this high pressure system?
Mean Sea Level Pressure (MSLP) has already reached 1039.3 hPa at Ouse, Tasmania on Sunday morning, and is forecast to peak at 1041 or 1042 hPa on Monday morning. MSLP refers to the atmospheric pressure adjusted for elevation and is commonly used by meteorologists to normalise air pressure to a single level (sea level in this case). This allows pressure systems to be compared and mapped across the planet on a synoptic chart.
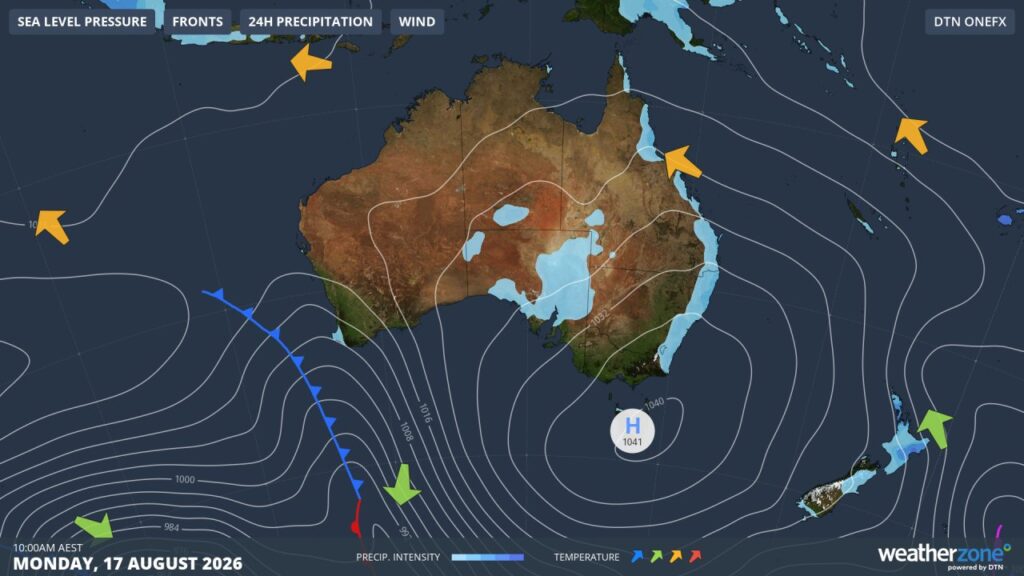
Image: Synoptic chart showing a powerful high pressure system centred over Tasmania on Monday, August 17, 2026. Source: Weatherzone.
High pressure systems are regions of higher MSLP and are usually associated with calm and dry weather due to dry air from the upper atmosphere descending towards the surface at the centre of these systems.
In contrast, low pressure systems are region of lower MSLP due to rising air. These areas of lower surface pressure are characterised by increased cloudiness, winds, rain and storms.
6 weeks ago, on Monday, July 6, 2026, the weather station at Ouse, Tasmania registered an MSLP of 1044.5 hPa, setting the highest MSLP on record in Australia. This beat the previous record of 1044.3 hPa set at Launceston on July 7, 1967.
This Monday is expected to fall 2-3 hPa short of the record, however the impacts of this high pressure system will be similar in strength and magnitude across broad parts of southern and eastern Australia in the coming days.
How will this strong high pressure system influence Australia’s weather?
Areas more directly underneath the central parts of this high will experience generally clear and calm conditions. This has allowed temperatures to drop quite significantly on Sunday morning, including minimum temperatures of:
- 3.0°C at Hobart Ap
- 2.7°C at Launceston Ap
- -4.7°C at Liawenee, Tasmania
- 6.1°C at Melbourne
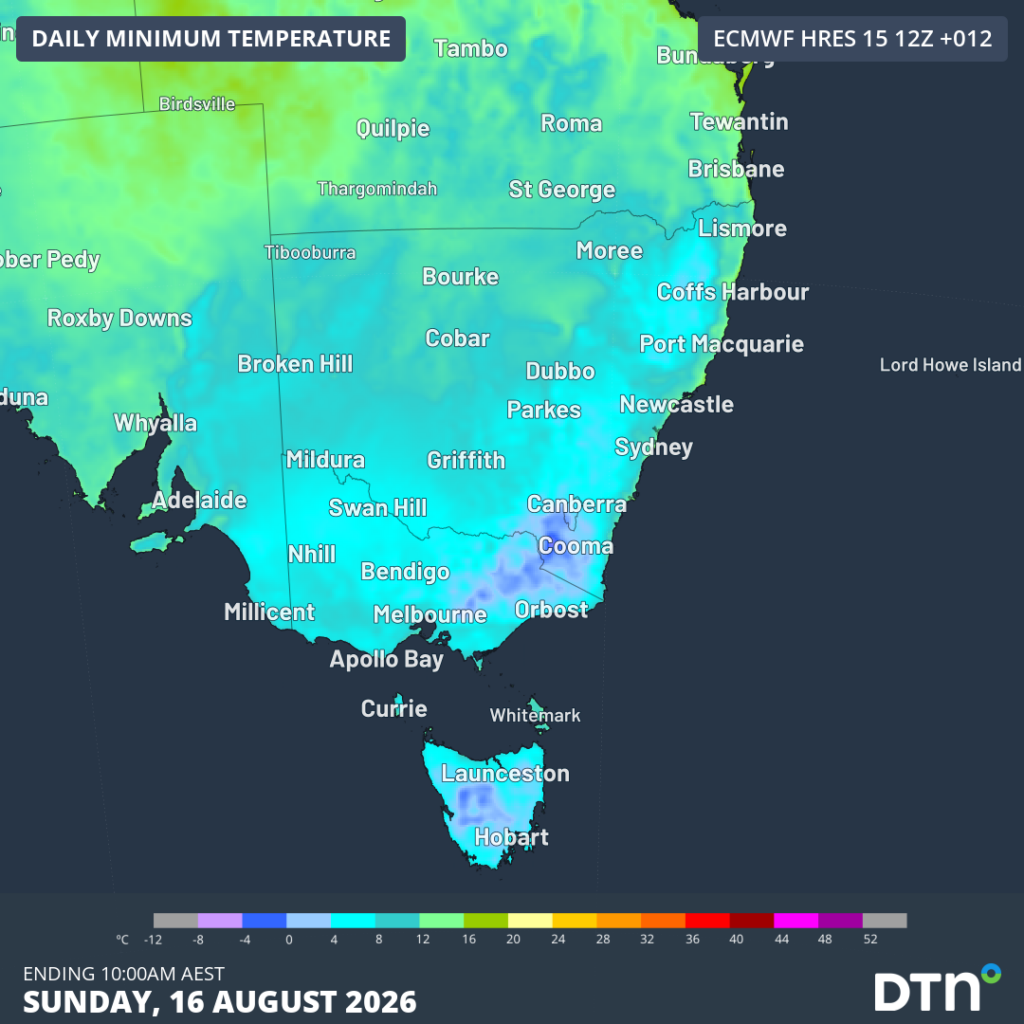
Image: Minimum temperatures on Sunday, August 16, 2026 across southeastern Australia. Source: DTN.
With this high strengthening further, another chilly morning is expected on Monday morning. Clear skies and cold conditions also led to widespread areas of fog, and some frost patches, experienced on Sunday morning over Tasmania and Victoria. Further widespread fog and frosts are expected over the next few mornings.
Video: Satellite imagery on Sunday, August 16, 2026 showing morning fog across parts of Tasmania and Victoria dissipating. Source: DTN.
For businesses and industries across southeastern Australia, widespread frost with cold morning temperatures can put crops and livestock at risk. Elevated energy consumption in the mornings, combined with low renewable wind energy output can also put strains on the energy market.
For the East Coast, onshore winds and showers are being directed by this high pressure system extending over 3,000km north of the central high pressure into Far North Queensland. Rainfall accumulations of 15-30mm are expected across much of the coast between NSW’s South Coast and Queensland North Tropical Coast from now to Wednesday.
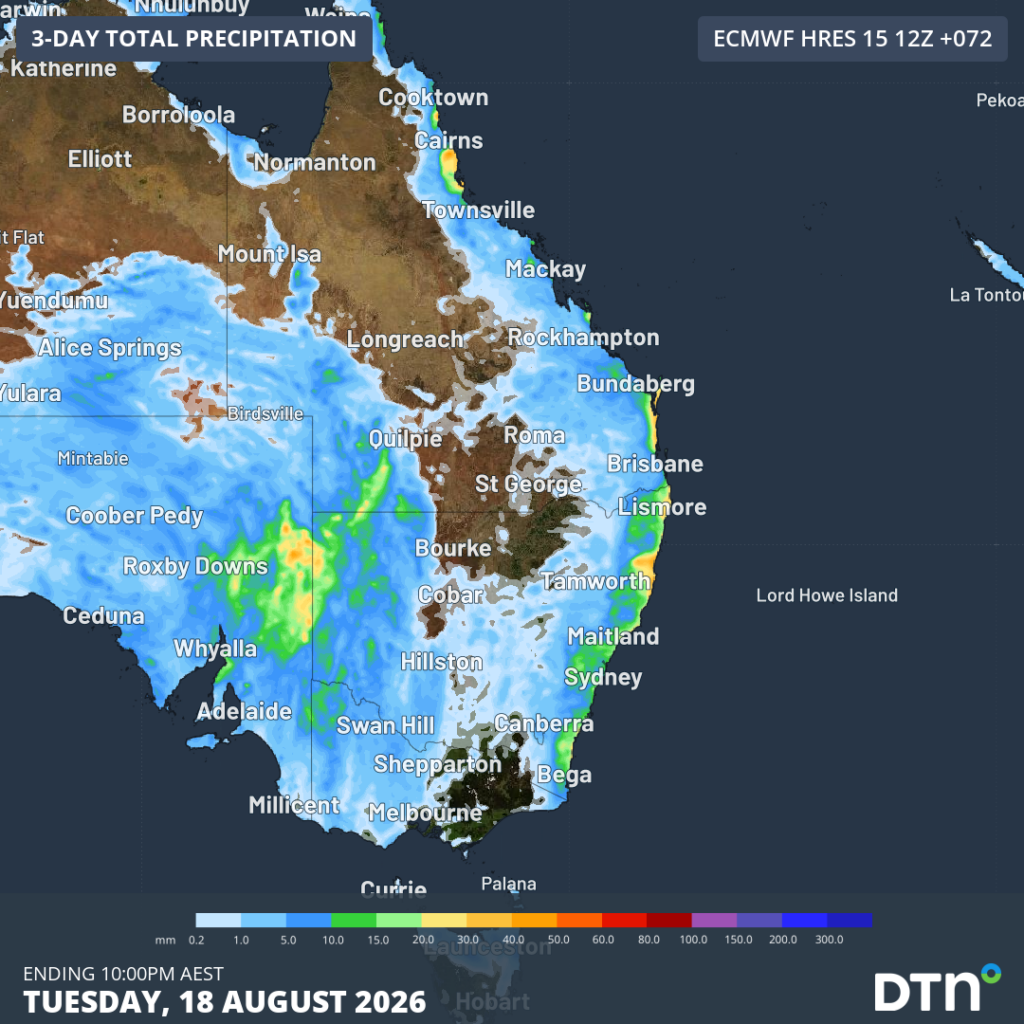
Image: forecast rainfall accumulations to 10pm AEST on Tuesday, August 18, 2026. Source: DTN.
A more direct impact from this dominant high is the weight of the air above Tasmania and southern Australia on both people and water. With the average global MSLP sitting around 1013 hPa, the extra 20-30 hPa meant there’s about 2-3% more air mass sitting above the region, equivalent to about 200-300 kilograms per square metre.
This 15-30 kilograms (up to 100-150 kilograms if lying flat!) above the average human can help ease joint pain and clear sinuses, but can also cause minor headaches.
In the oceans, the added pressure pushes sea level down by around 1 centimetre by each 1 hPa increase. The 20-30 centimetre drop will be most noticeable on the low tides this Sunday and Monday, possible making some river bar crossings a little more challenging for boaters, and possibly revealing some interesting sand bar formations on the coastal stretches.
Port and shipping operations rely on accurate water levels to ensure adequate draught. While most ports operate within deep water channels, river mouth entrances can accumulate sandbars in between dredges that can become dangerous to traverse at low tide during periods of reduced water levels.
Changes in pressure with the changing climate
Climate change and the expansion of the tropical region is increasing the intensity and frequency of these dominant high pressure systems.
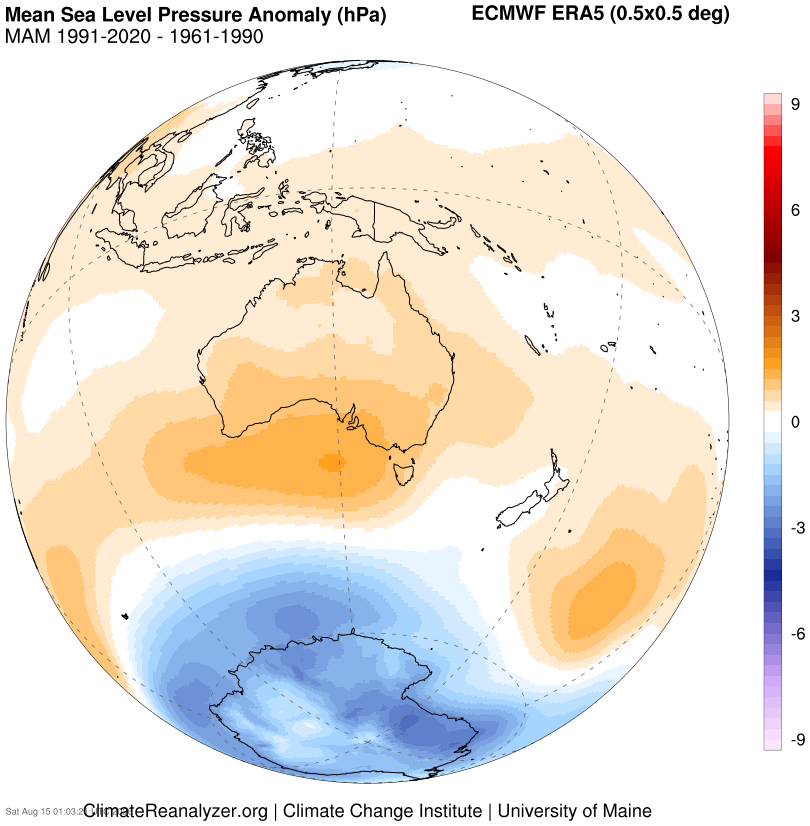
Image: MSLP anomalies across the latest 30 years (1991-2020) compared to the 30 years prior (1961-1990) showing the intensification of high pressure over southern Australia during Autumn. Source: ClimateReanalyzer.org
Intense solar heating in the tropics causes air to rise into the upper atmosphere. This air then moves polewards, cools and sinks over the mid latitudes, forming our high pressure systems over Australia, before moving back towards the equator, warming and closing this loop called the Hadley Cell.
The warming climate is intensifying this circulation, causing the descending branch of the Hadley Cell into Australia’s latitudes to be stronger and further south. This trend is evident across southern Australia throughout the year, but is most pronounced during autumn and winter.
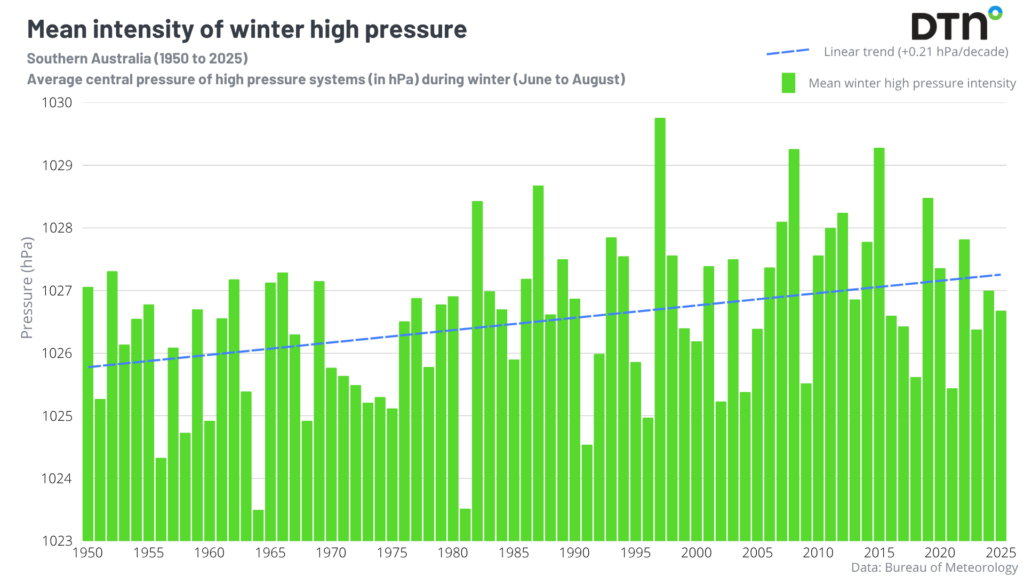
Image: Mean intensity of winter high pressure (MSLP) over the past 75 years across southern Australia, with the linear trend (blue) showing the increase in intensity. Data Source: Bureau of Meteorology.
While high pressure is known to bring more settled weather, more intense and frequent highs can also enhance weaker low pressure systems, driving broader areas of strong winds, more persistent heatwaves and subdue rainfall over key agricultural regions. Lows often only affect one or two states, in contrast, broad high pressure systems like the one currently centred over Tasmania have expansive reaches into the far north of Queensland and west across the Great Australian Bight, bringing widespread impacts to much of the country.
How DTN APAC Risk Communicators inform your decision making with tailored weather and seasonal climate outlooks
DTN APAC is a diverse team, with global forecasting, product development and analytics expertise. Couple this with extensive industry experience spanning Mining to Energy, and we are primed to assist you in strengthening your response to weather impact. Learn more about our Risk Communicators.
We work hard to identify your operational pressures and tailor our services and products to meet your needs. Concise communication, giving you full situational awareness exactly when you need it, is our focus. We want to reduce weather risk in your operations, every day.
We deliver clear and comprehensive weather data that you can’t get anywhere else, personalised risk assessments and briefings to you and your team, so that your critical decisions can be made with confidence.
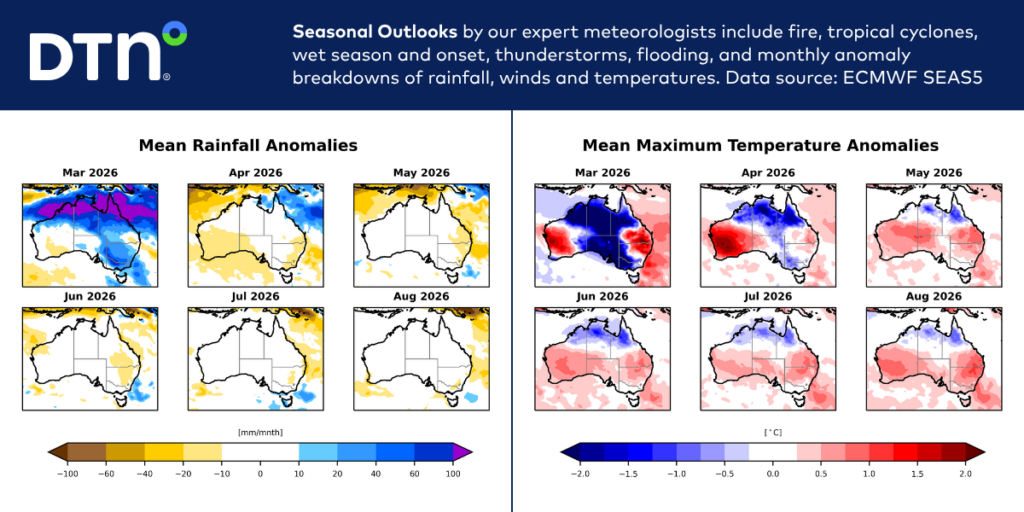
Image: Sample Seasonal Outlooks briefed by our Risk Communicators, featuring Mean Rainfall Anomalies and Mean Maximum Temperature Anomalies from March to August 2026.
We are available 365 days a year, so you always have the timely guidance you require, especially when extreme temperatures hit.
Learn more about our large range of industry-leading products and services, or email us at sales.apac@dtn.com




