Waters off Indonesia have cooled in recent weeks, an indication that a positive Indian Ocean Dipole (IOD) event could be developing. It’s an important climate driver for Australia, and it could shape rainfall and temperatures heading into summer, with flow-on effects for farmers, energy and other industries.
What is the Indian Ocean Dipole?
The IOD is a climate driver that measures the difference in sea surface temperature anomalies between two regions of the tropical Indian Ocean: one off the east coast of Africa and the other southwest of Indonesia.
A positive IOD occurs when the western region is warmer than average and the eastern region is relatively cooler. This usually reduces the moisture flowing towards Australia and is typically linked to drier, warmer conditions across central and southern parts of the country in spring. A negative IOD does the opposite and often brings above-average rain.
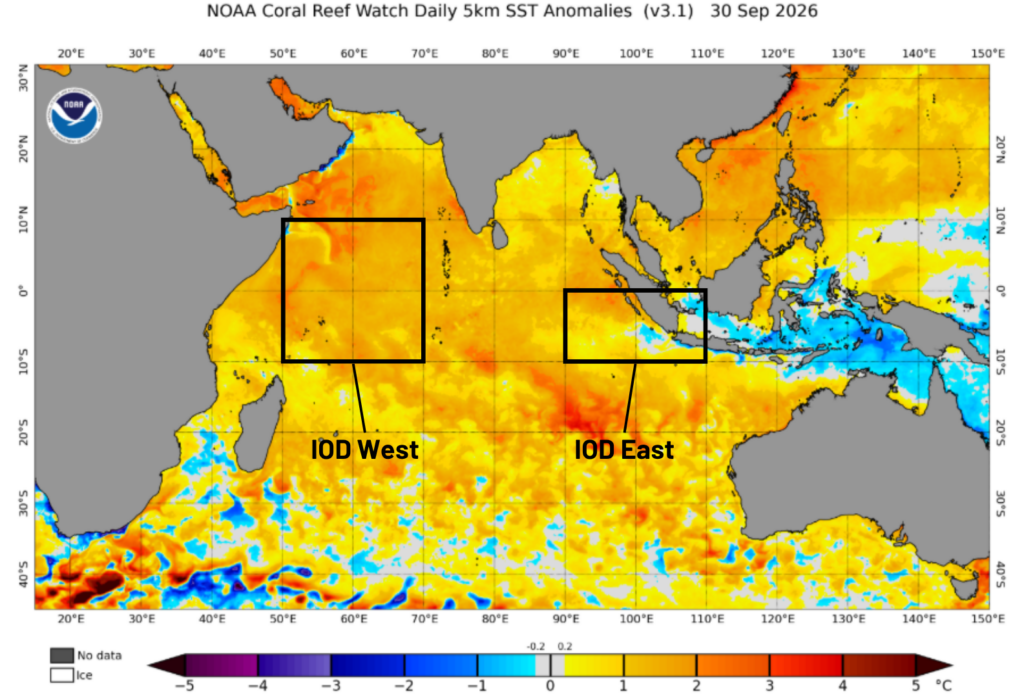
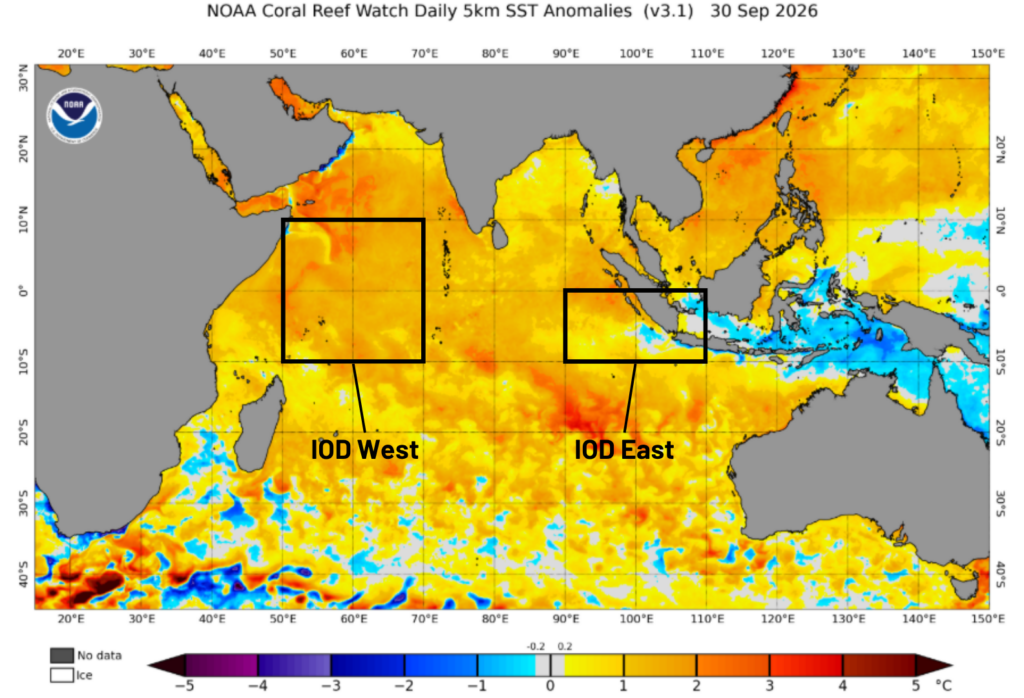
Image: Sea surface temperature anomalies across the Indian Ocean on 30 September 2026. Source: NOAA Coral Reef Watch.
Is a positive IOD developing?
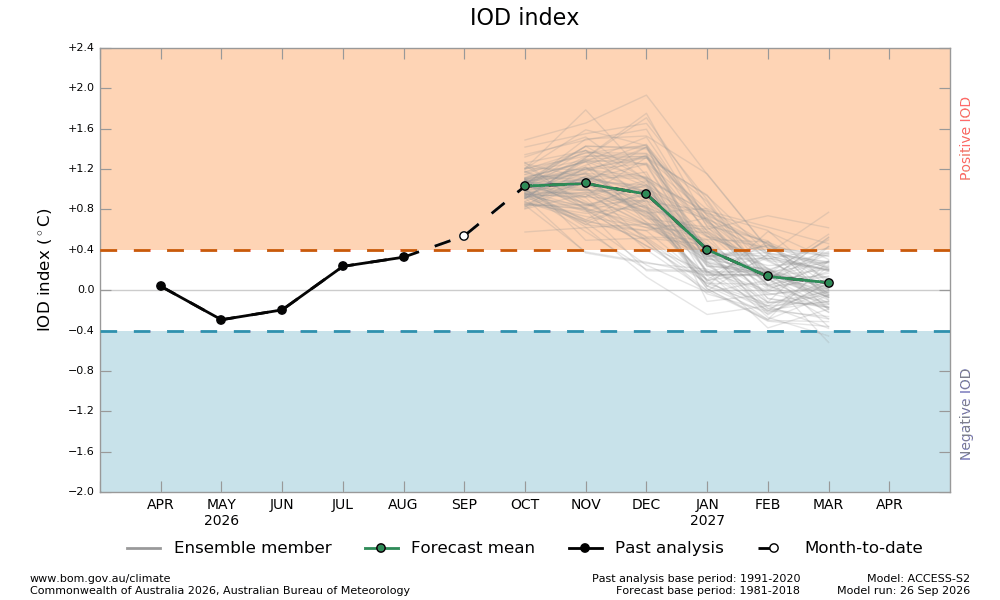
The weekly IOD index has been above the positive IOD threshold of +0.4°C for three weeks, with the latest reading of 0.76°C in the week ending September 27. If it stays above the threshold for four weeks or more, the chance of impacts on Australian weather increases.
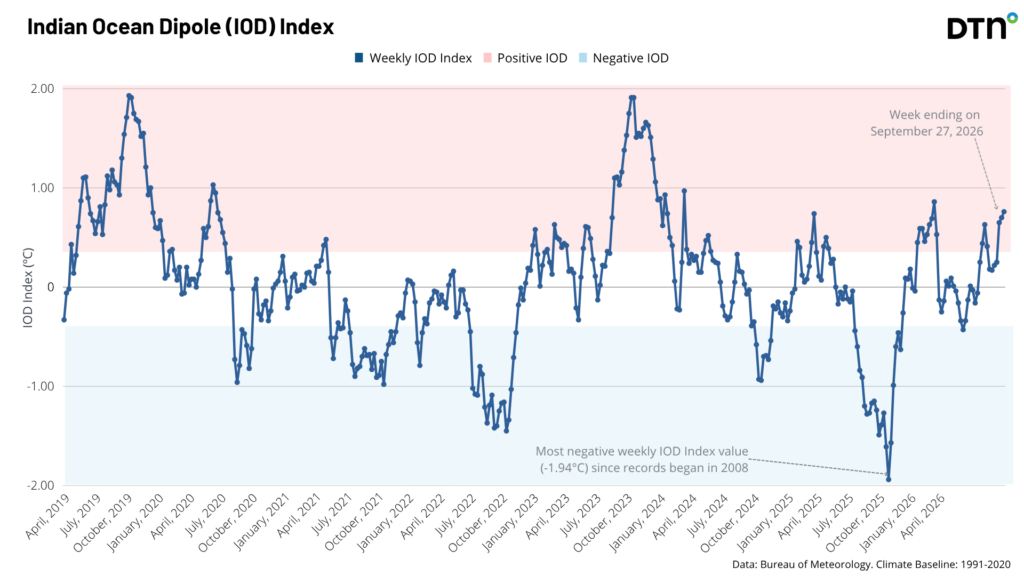
Computer models are also forecasting a positive event, with the Bureau of Meteorology’s ACCESS-S2 model keeping the index above the threshold through December. It then eases back to around the threshold in January, which is typical, as these events tend to break down once the northern monsoon arrives. The late arrival of the monsoon forecast is due to El Niño’s influence.
Historically, positive IOD years have often brought below-average October to December rainfall to central and southern Australia, though parts of the Western Australian interior have stayed near or above average.
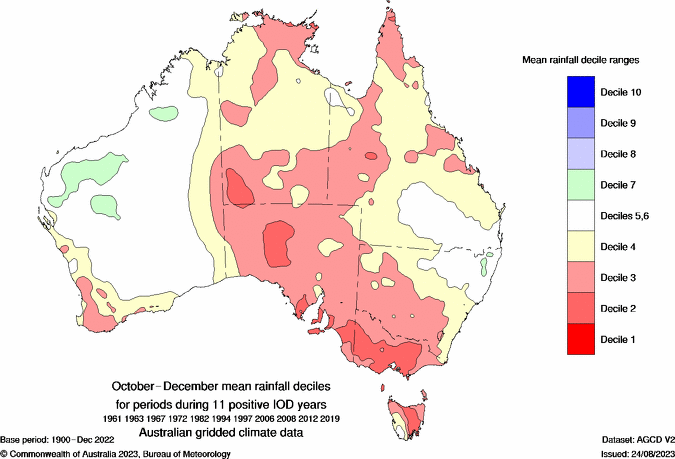
Image: October to December rainfall deciles during past positive IOD years. Source: Bureau of Meteorology.
In addition to the potential positive IOD, a near record breaking El Niño is underway. Past El Niño springs show a similar split to the IOD, with parts of inland Western Australia often wetter and the south-east drier than usual. The Bureau’s northern rainfall onset outlook also favours a later start to the rains across Queensland and the Top End, and an earlier start across much of Western Australia and the western Northern Territory.
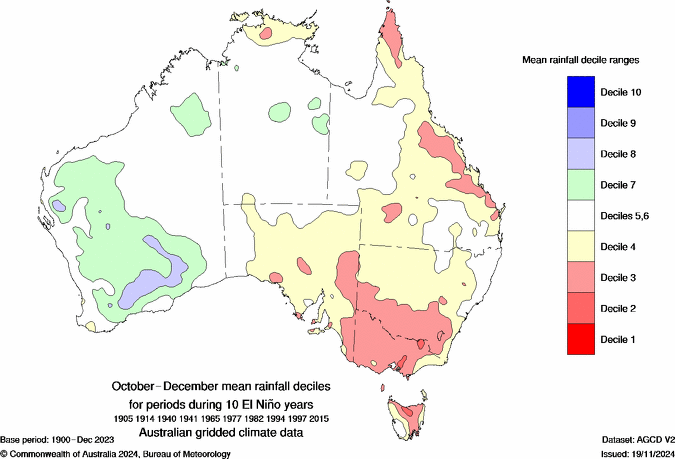
Image: October to December rainfall deciles during past El Niño years. Source: Bureau of Meteorology.
A positive IOD, but not a textbook one
The latest sea surface temperature map shows something unusual. Waters are above average across most of the Indian Ocean basin, with the strongest warmth in the western IOD region. Cooler pockets are present near Java and further east around Timor and the Banda Sea, but much of the eastern IOD region is still slightly warm.
That means the positive reading is driven largely by the west warming more than the east, rather than by a clearly cool east. This broader warmth may be one reason seasonal models aren’t showing the widespread dry signal a positive IOD would normally bring. This is an interpretation, not an established finding.
Unusually warm waters add humidity to the air above them. When a trough sets up over Western Australia and north-westerly winds draw that moisture inland, the result can be extra cloud, rain and storms.
That is what happened in September. On 7 September, Leonora in the Goldfields recorded 58.8 mm, its wettest September day on record, and flooding closed major roads around the town in a region where September is normally the driest month. Three weeks later, DTN’s lightning network detected more than 1.3 million lightning pulses within 800 km of Leonora in 48 hours.
DTN’s analysis links the storms to moisture from the warm Indian Ocean feeding a trough over the state, alongside El Niño and a weakly positive IOD. In late September, a hotspot 2 to 3°C above average sat well off WA’s northwest coast.
What are models showing?
The ECMWF model shows:
- October: below-average rainfall along the east coast and across southern Victoria, with a slight wet tilt across the southern interior of Western Australia and South Australia.
- November: the wetter tilt widens across central Australia.
- December: drier across the Top End and Cape York, with wetter signals across parts of the interior and New South Wales.
Most of these anomalies are modest, so they point to a shift in the odds rather than a guarantee.
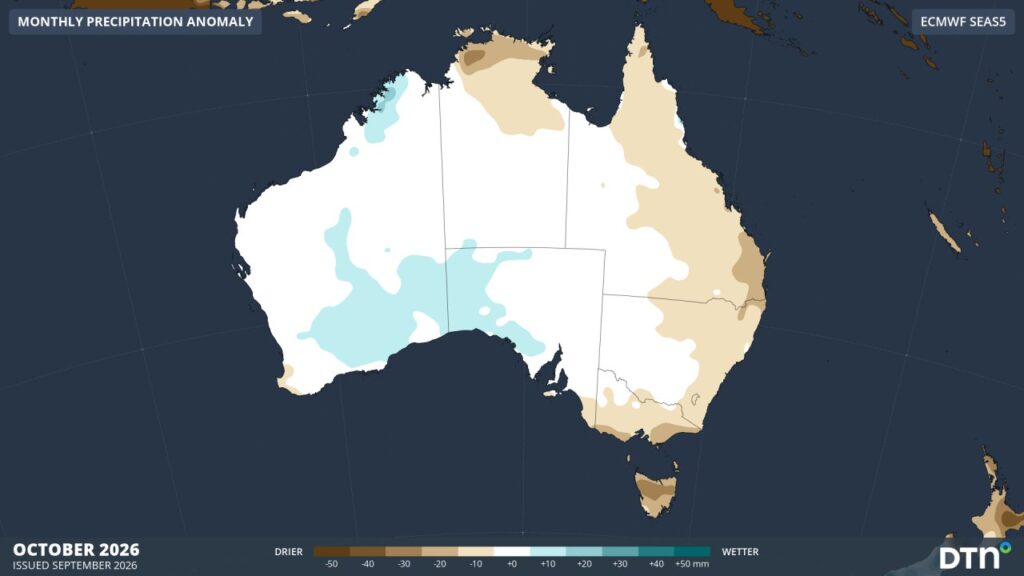
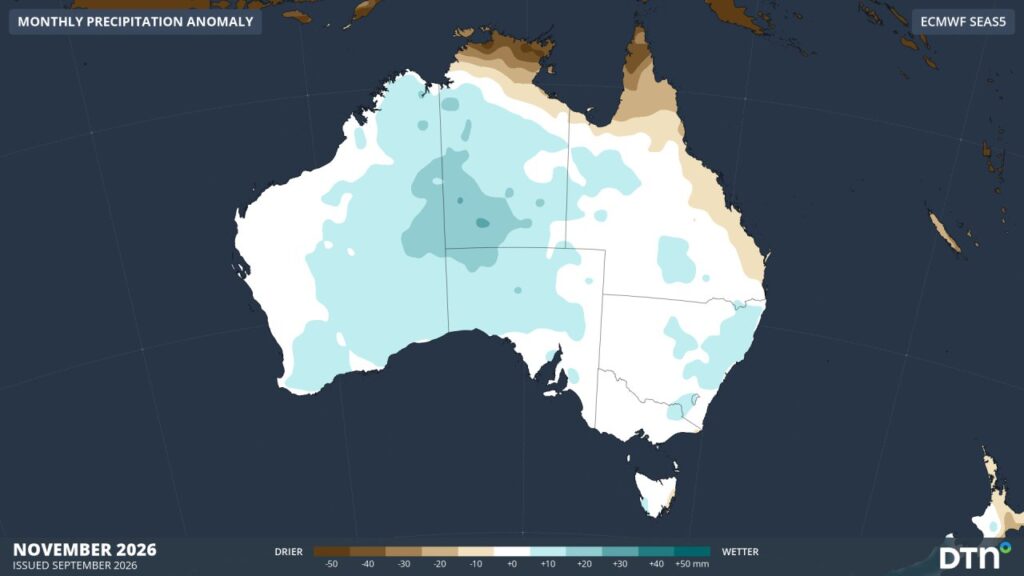
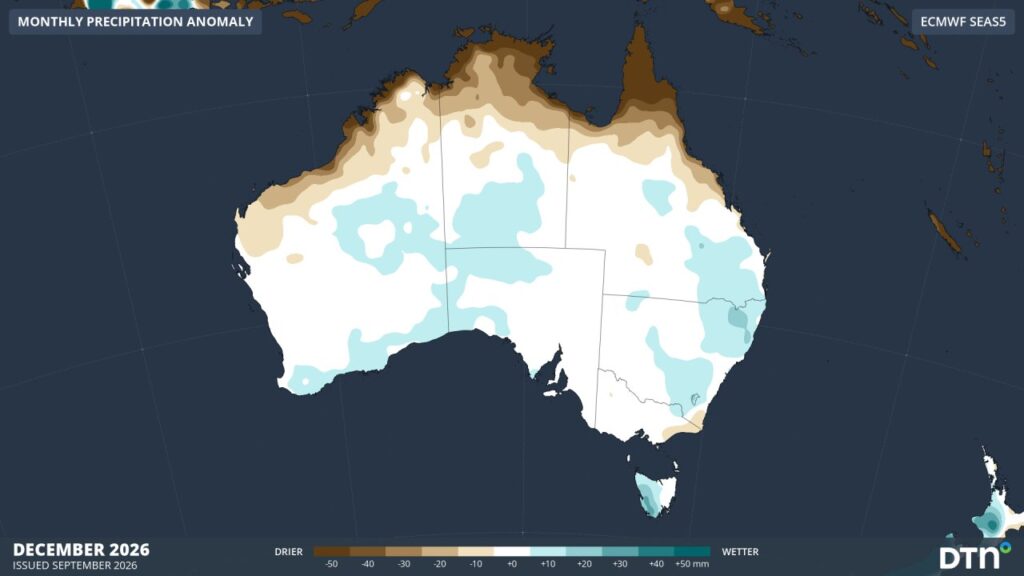
Images: ECMWF SEAS5 monthly rainfall anomaly forecasts for October, November and December 2026. Source: DTN.
What it could mean for mining
September showed how quickly weather can disrupt mining country. Lightning is a safety issue for open-cut pits and outdoor crews. Flooding and road closures can interrupt haulage, fly-in fly-out movements and supply deliveries, and storms can threaten power to remote sites.
Potential impacts for WA mining
- Goldfields and interior mining: the wetter tilt in the seasonal models means a higher chance of further storms and short-lived flooding events on roads and haul routes, even though the region normally dries out in spring. Seasonal model signals are modest, so this is a tilt in the odds, not a forecast of any one event. DTN expects storms to continue across a broad area of WA into early October.
- Pilbara and Gascoyne coast: the Bureau gives a 55 to 75% chance of a later-than-normal northern rainfall onset along this coastline, though an earlier onset is favoured across much of the rest of northern WA. Wet season planning for port and rail operations should allow for both.
Impacts on other industries
- Agriculture: a wetter tilt across the interior of WA and SA is good news for cropping and grazing, but the east looks drier in October, and soil moisture is already below average across much of the east. Southwest WA has historically leaned drier in El Niño springs.
- Northern industries: a later start to the wet season in Queensland and the Top End could affect pasture growth, mustering schedules and horticulture planting.
- Energy and water: a warmer, drier east could lift cooling demand and put pressure on supply into summer.
- Fire and insurance: the Bureau has flagged an elevated fire risk this season in parts of Gippsland, the far south-west and western Victoria.
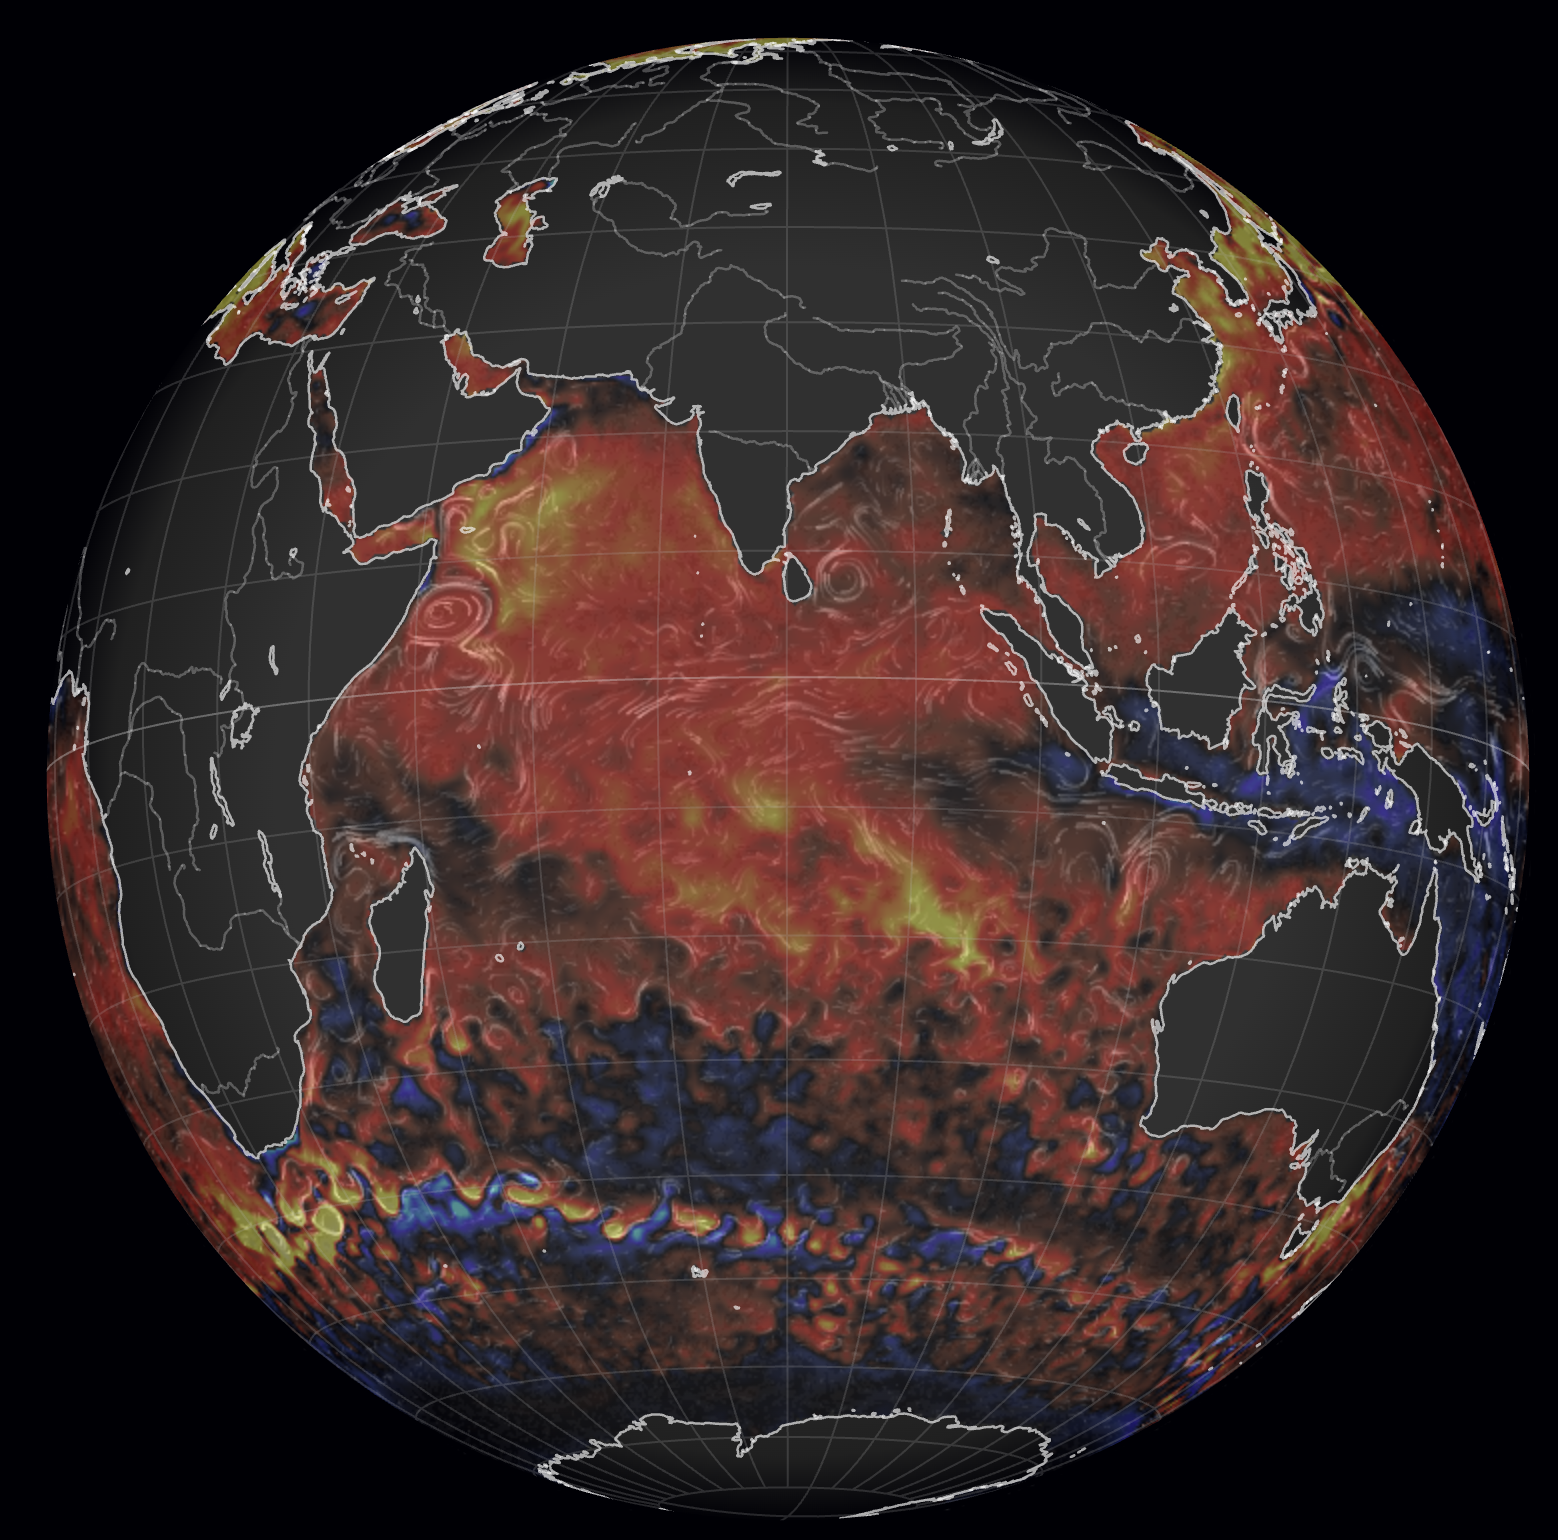
Thumbnail map: earth.nullschool.net by Cameron Beccario. Data: OSTIA, UK Met Office / GHRSST / E.U. Copernicus Marine Service.