A huge dust storm and gusty westerly winds whipped up by a powerful cold front crossing southeastern Australia have led to airport disruptions and diversions on Monday and Tuesday.
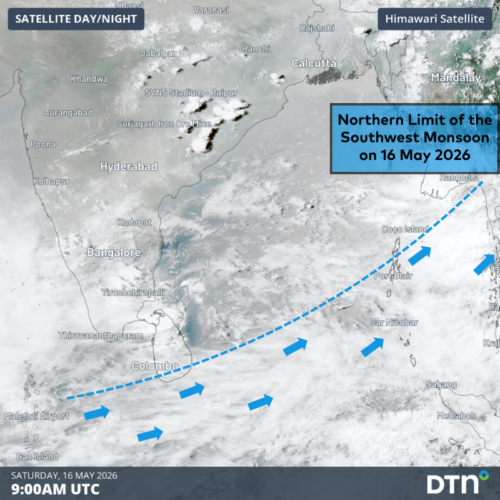
A powerful cold front passing over drought-affected areas of SA and Victoria on Monday caused dry topsoil to become airborne as strong winds scoured the parched landscape. By 3pm on Monday, a massive cloud of dust was stretching around 600 km across eastern SA, northwest Victoria and southwest NSW.
Image: Visible satellite images showing a dust storm developing over the dry SA outback on Monday afternoon.
A flight from Adelaide to Mildura Airport approaching from the south had to do a go-around and land on the east-west runway after coming within 200m of the ground before pulling up due to unsuitable landing conditions, most likely due to the gusty winds and poor visibility.
Dust as seen from the DTN APAC Stormtracker
DTN APAC’s Stormtracker is our Global Information System (GIS) tracking tool, providing multiple weather layers and zoom controls overlaid on a map of your location and infrastructure. The Stormtracker Dashboard map below shows false colours corrected satellite imagery to help differentiate cloud from dust, with the dust appearing pink. The aviation Terminal Aerodrome Forecast (TAF) for each airport can also be overlaid to display the latest aerodrome forecast in real time. The TAF displayed in the image below for Mildura Airport shows the 1000 BLDU VV020 code, which refers to BLowing DUst, bringing visibility down to 1,000 m and vertical visibility down to 2,000 feet, which are significant conditions for aviators.
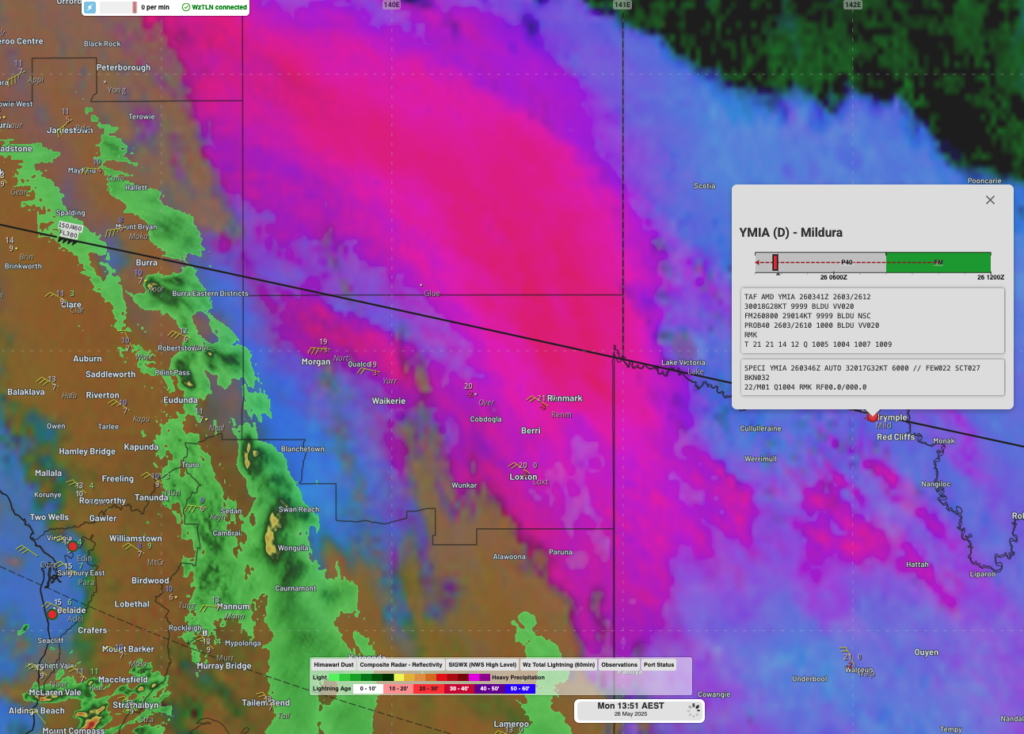
Image: False-colour satellite image showing a large dust storm (pink) crossing eastern South Australia on Monday afternoon, with the Mildura TAF showing BLDU (Blowing Dust).
The maps allow you to monitor all weather, and specifically any systems likely to cause risk for your business. You also have the capacity to observe:
- Real-time lightning and thunderstorm alerts;
- Localised lightning strike frequency;
- Official warnings for storm, cyclone, wind, flood and fire; and
- Sentinel hotspot fires and fire agency current incidents.
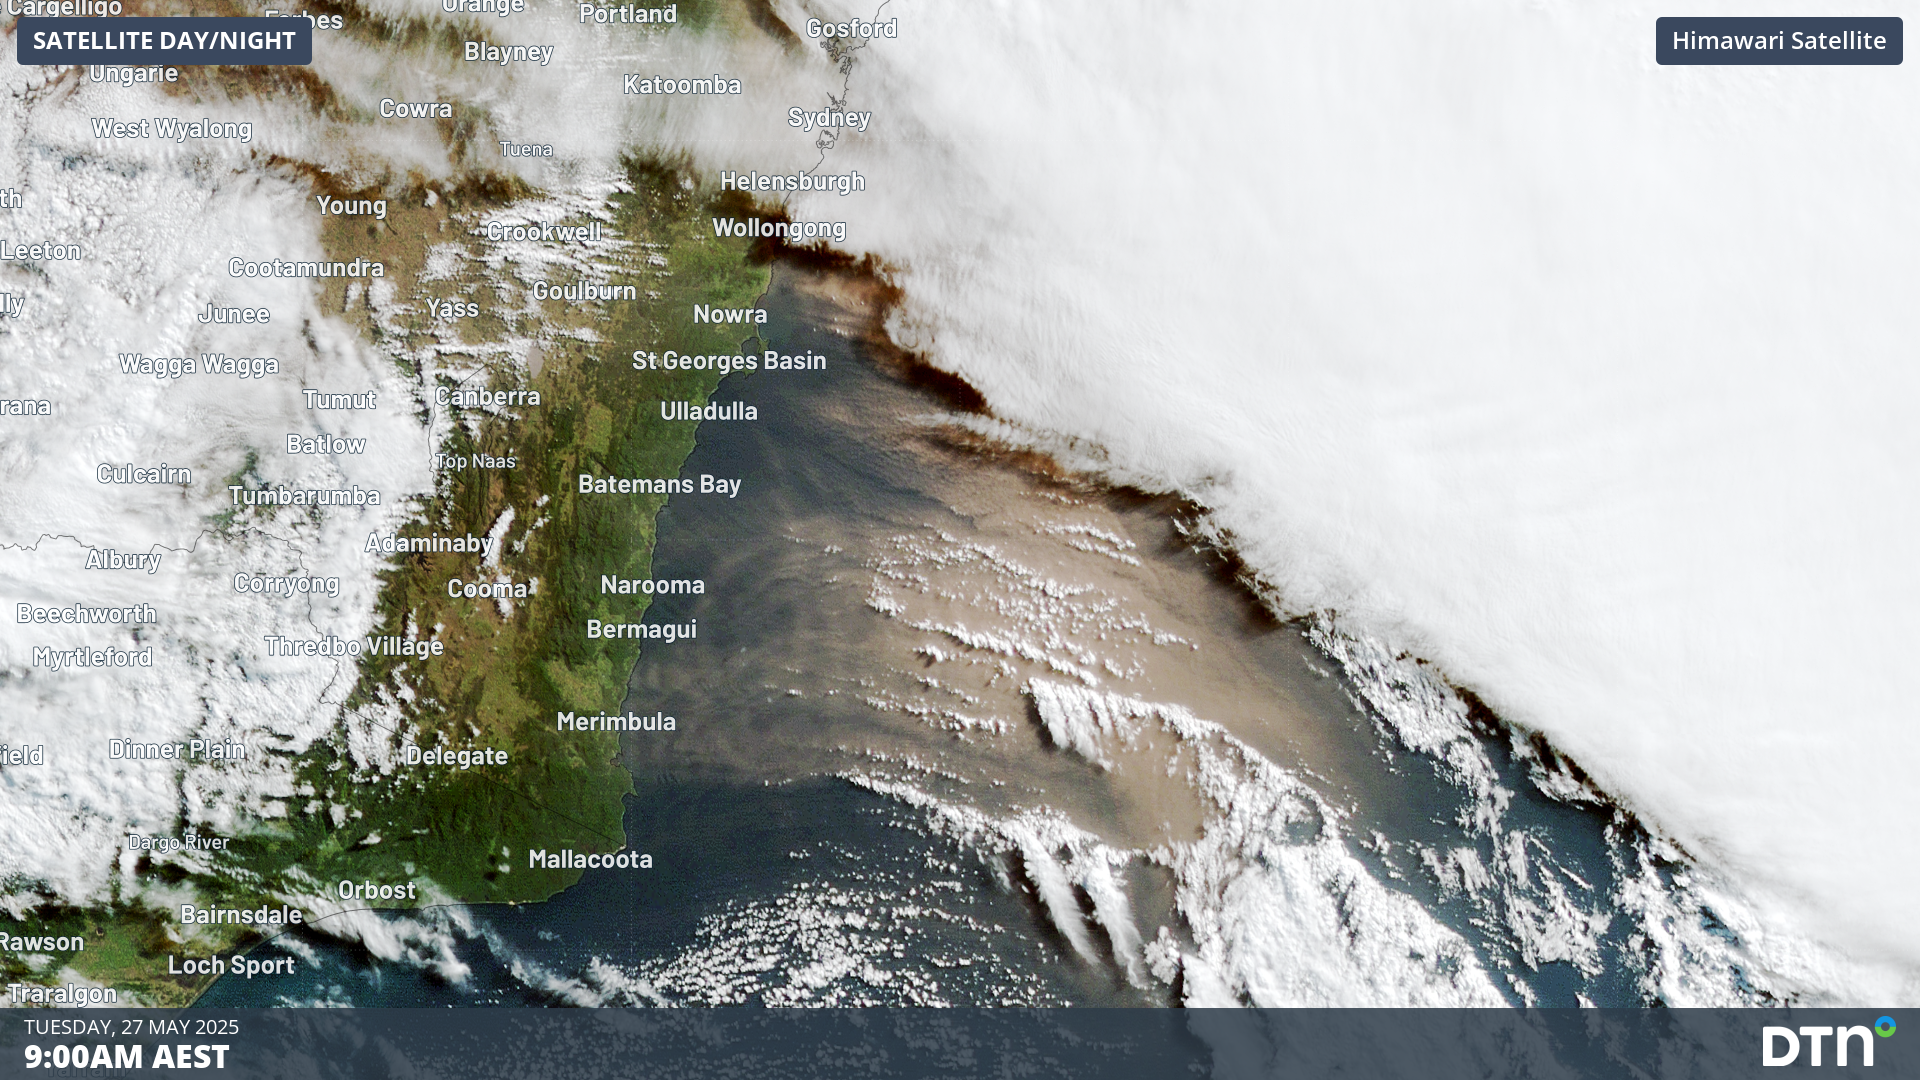
Eastern NSW aviation impacted by dust
Video: False-colour satellite images showing a large dust storm (pink) crossing southeastern Australia on Monday into Tuesday morning.
The dust whipped up on Monday travelled towards the east overnight and by sunrise on Tuesday, it had reached eastern NSW and the Tasman Sea. While the dust had thinned out during its long journey from SA to the country’s east coast, there was still enough to cause a hazy start to the day leading to some aviation disruptions and diversions.
Observations from Canberra Airport and other aerodromes across the Illawarra and South Coast regions of NSW reported haze overnight, with visibility reduced to around 4,000-6,000 m as the dust blew east.
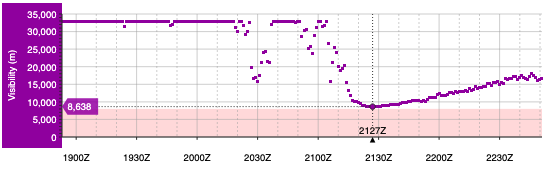
Image: One-minute observations at Wollongong Aerodrome reducing close to the lowest operational visibility (pink) as seen on the DTN Aviation Watch dashboard.
DTN Aviation Watch: Your Customisable All-in-One Aviation Dashboard
As seen in the image below, DTN APAC’s Aviation Watch shows conditions and forecast for Sydney Airport on Tuesday morning. Haze (coded as HZ) with a visibility of 5,000 m was reported by the latest METAR, with a forecast for Dusk (coded as DU) with a visibility of 5,000 m and vertical visibility of 2,000 feet.
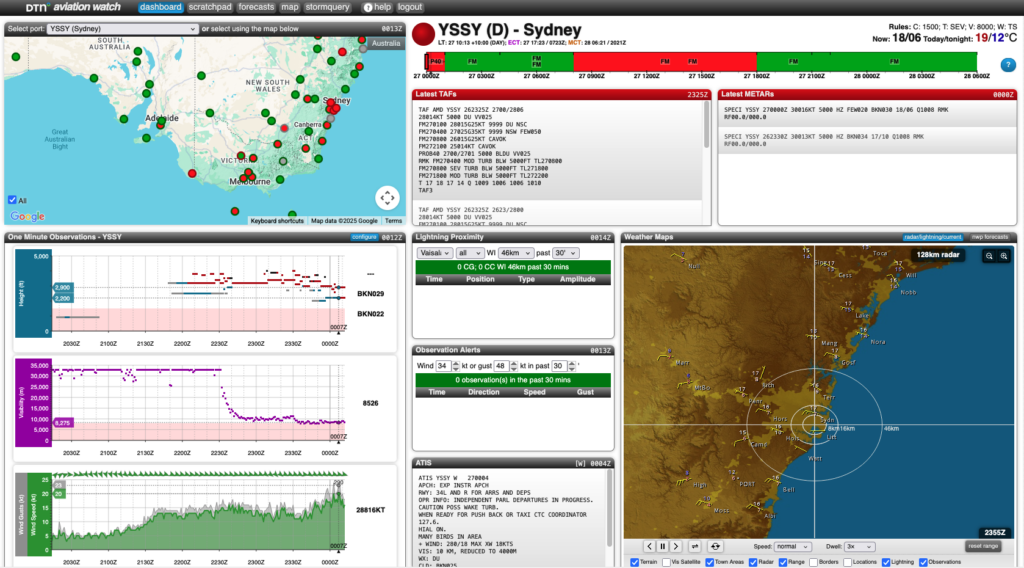
Image: DTN APAC’s Aviation Watch dashboard for Sydney Airport (YSSY) on Tuesday morning.
Aviation Watch is DTN APAC’s customisable delivery system – painting the full weather and aviation picture – purpose-built to meet the unique requirements of the airline industry.
Aviation specific information, your operational inputs, lightning and severe weather alerting, and forecasting are all seamlessly integrated on Aviation Watch’s easy-to-visualise interface.
You have access to unique timelines that effectively decode the TAF/METAR data into a visual time band – relative to the minima for that port – giving you a clear overview of how conditions are forecast to change. For example, hovering over the time band reveals that dust is forecast to clear to from 0400 UTC (2pm AEST) as westerly winds increase to 25 knots, gusting to 35 knots.
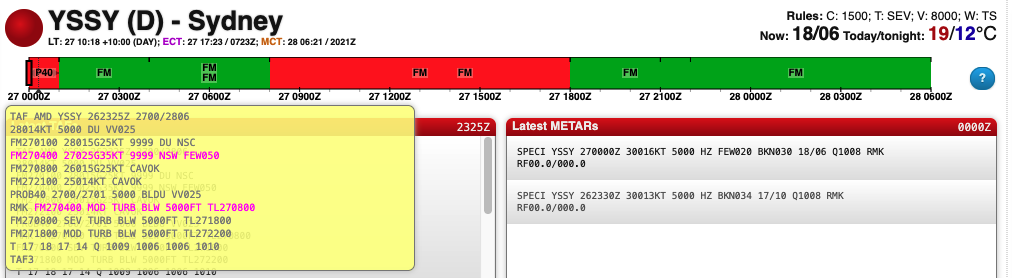
Image: DTN APAC’s Aviation Watch TAF time band for Sydney Airport (YSSY) on Tuesday, May 27.
Crucial weather data and tools supporting Aviation operations
You have these parameters at your fingertips, with further options available, as you customise your own dashboard:
- Temperature/precipitation/relative humidity/QNH/pressure
- Dangerous thunderstorm and lightning proximity alerting
- TAF/METAR/SIGMET data
- ATSAS
- ATIS data
- Wind calculator and wind shear tool
- Dangerous Thunderstorm and Lightning Proximity Alerting
- Skew-T and meteogram generation
- Vertical profile route cuts
The turn to strong and gusty westerly winds risks reducing Sydney’s Airports from the two north-south runways to the singular east-west runaway. The wind calculator tool in the DTN APAC Aviation Watch dashboard can easily calculate runway cross (R) and tail (T) winds. As seen in the example below, the forecast 25 knot wind from the west (direction of 270°) results in a crosswind of 24 knots (24R). Sydney Airport typically change runways when crosswind gusts exceed 20 knots, so the airport could be operating under a single runway this afternoon.
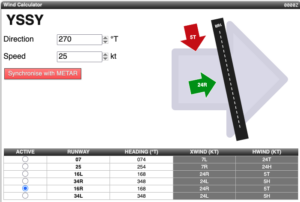
Image: DTN APAC’s Aviation Watch Wind Calculator tool across Sydney Airport’s north-south runway under a 25 knot westerly.
Serving the needs of pilots, ground crew and support staff, Aviation Watch provides critical intelligence, in a format that enables quick decision making.
The efficiency and safety of your operations are fully supported by the most accurate data available. With this foresight you can assess flight paths, fuelling and staffing needs with ease, and protect your passengers, staff and bottom line.
Learn more about our large range of industry leading products and services or email us at sales.apac@dtn.com