
Sydney has ended its third warmest summer on record with a warm and muggy day featuring afternoon thunderstorms – providing a fitting end to what was an unusually sweaty season for the NSW capital city.
Sydney’s mean temperature this summer will come in at around 24.1ºC, which is just over 2ºC above the long-term average. This will be the third highest summer mean temperature ever recorded at Sydney’s Observatory Hill weather station, where records date back to 1858.
The only two years with mean summer temperatures higher than this season were the summers of 1990-91 (24.6ºC) and 2016-17 (24.8ºC).
Sydney’s average maximum temperature of 28.4ºC this summer was also the 4th highest on record, falling around half a degree behind the record from 2016-17.
One of most memorable things about this summer for Sydneysiders will be the abundance of sweat, thanks to abnormally high dew point temperatures in eastern NSW over the last few months.
The dew point temperature is a measure of how much moisture is being held in the atmosphere as water vapor. Higher dew points mean more airborne moisture, which can make hot days feel more uncomfortable because it becomes harder for sweat to evaporate from our skin.
As a rough guide, dew point temperatures around 10 to 15°C are comfortable for areas like Sydney and Brisbane. Once the dew point climbs above 20°C it gets muggy and uncomfortable, while dew points over 24°C become oppressive.
Sydney’s dew point temperature frequently reached the low-to-mid twenties this summer. Even on the last day of the season it climbed to 25°C in the afternoon. In early January, it exceeded 26ºC briefly and set a new record for the highest hourly dew point ever recorded in the city. These dew points are more commonly found in Darwin than in Sydney.
Sydney’s abnormally high dew point temperatures this summer were largely due to unusually warm sea surface temperatures in the Tasman Sea. This warm water to the east of NSW enhanced evaporation and led to more moisture in the atmosphere, which was then carried over NSW by frequent periods of easterly winds.
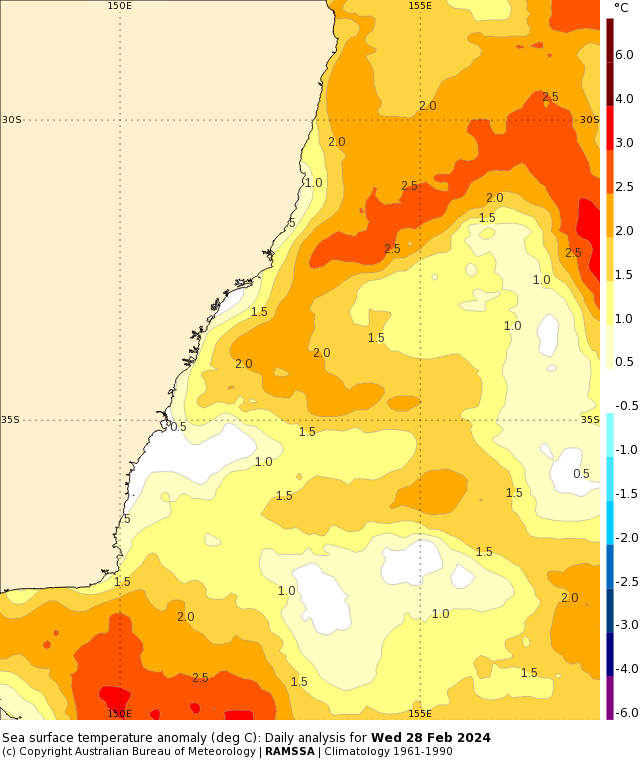
Image: Sea surface temperature anomalies on February 28, 2024, showing warmer-than-average water over most of the Tasman Sea at the end of summer. Source: Bureau of Meteorology
This extra atmospheric moisture also helped produce rain and storms, including a few storms in and around Sydney on the final day of the season. While this summer’s accumulated rainfall total of around 410 mm* was lower than last summer’s 445.6 mm, it was still about 82 mm above the seasonal average.
*Note that there were a few days with missing rainfall observations at Observatory Hill in February. This summer’s rainfall total has been estimated using observations from Sydney’s Botanic Gardens for the days where observations were not available at Obs Hill.
DTN APAC can provide solutions for your business to alert you of the most likely weather conditions and hazards to look out for during the upcoming season. Now is a good time to get a good look at the forecast for autumn and a look deeper into 2024. To find out more please email apac.sales@dtn.com.


