
It’ll come as one heck of a surprise for residents of Australia’s east coast – and especially those from southeast Qld and NSW – but Australia as a whole was drier than usual in March.
That’s right, according to the Bureau Of Meteorology March summary:
- March rainfall was 27% below average for Australia as a whole, even though it was the highest on record for areas of the central and northern New South Wales coast.
- The parts of the country that experienced below-average rainfall included most of the Northern Territory, western and central parts of Queensland, western parts of Tasmania (which we wrote about here), and much of South Australia’s Eyre Peninsula.
The rainfall data for March is best illustrated by the BoM’s rainfall deciles chart, which shows how much rain fell relative to what’s expected to fall on average.
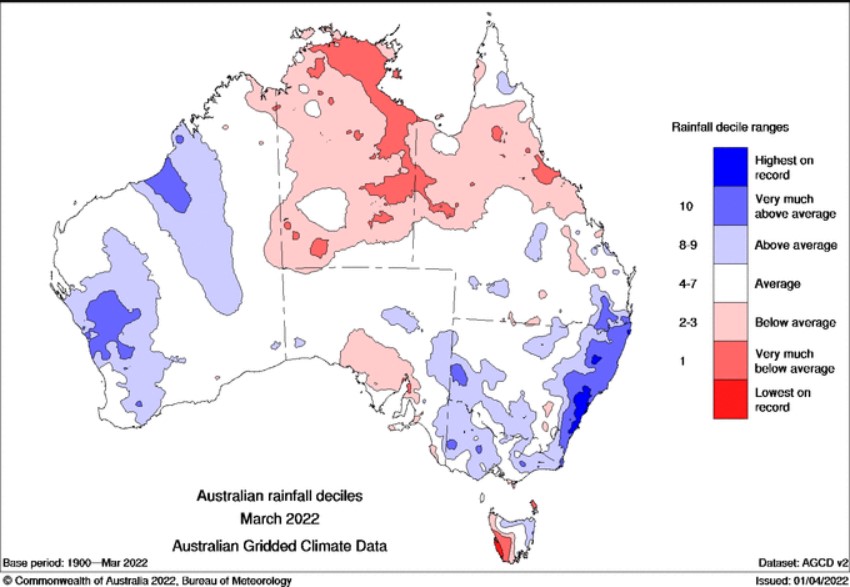
Source: BoM.
But the overall rainfall data wasn’t the only remarkable aspect of Australia’s weather in March. It was also warmer than usual:
- The national mean temperature for March was 1.68°C warmer than the 1961–1990 average for Australia as a whole, and the fifth-highest on record for March.
- Those warm temps were recorded across much of Australia, with numerous sites across the east central coast and adjacent inland areas of Queensland, plus large areas of the inland Northern Territory, experiencing their highest mean maximum temperature on record for March.
- As you’d expect given the strong La Niña influence, max temps for March were on average cooler than average along most of the NSW coast and adjacent inland areas, as well as Victoria’s East Gippsland. (Consistent cloud cover and rain tends to generate cooler daytime temps.)
- But parts of NSW which are well away from the coast were also warmer than average.
- Large parts of all states and territories had warmer-than-average minimum temperatures in March.
- On March 9, Darwin equalled its hottest March day on record, reaching 36.0°C, during a widespread heatwave across northern Australia.
The historical significance of the warm March temps are best illustrated by the BoM’s maximum temperature anomaly chart, which shows how much warmer than usual daytime temps were in various parts of the country.
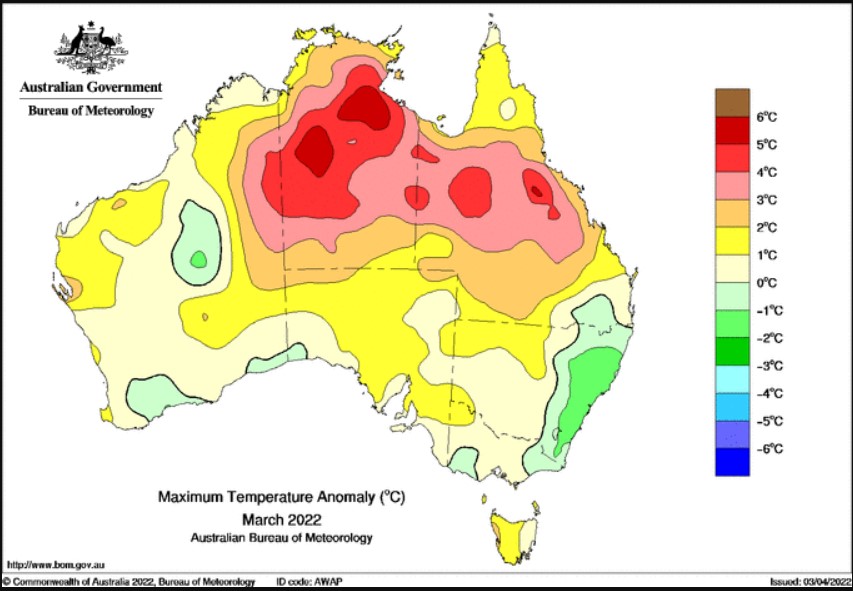
Source: BoM.
As you can see, the soggy eastern third of NSW was a little cooler than usual but nearly everywhere else was warmer. For more information on Weatherzone’s seasonal forecasts, please contact us at apac.sales@dtn.com.


