Parts of Australia are having one of their wettest Novembers on record during El Niño. This is a juxtaposition that may seem surprising, but it is actually a timely reminder of Australia’s fickle relationship with broad-scale climate drivers.
El Niño has been in the news a lot this year since it was initially declared by NOAA’s Climate Prediction Center back in June. Since then, the World Meteorological Organization and Australia’s Bureau of Meteorology have also made official El Niño declarations and the event has continued to gain strength in recent months.
El Niño is a well-known global climate driver that promotes below average rain and above average daytime temperatures in Australia, particularly in winter and spring. El Niño has underpinned some of our country’s most severe droughts and its name has become synonymous with dry and hot weather in Australia.
However, it is important to understand that no two El Niño events impact Australia in the same way and it can still rain when El Niño is occurring.
Taking a closer look at this year’s event, El Nino’s influence on Australia’s climate was clear in the first two months of spring. Both September and October featured below average rain over most of the country and this period was Australia’s driest two months in records dating back to 1900.
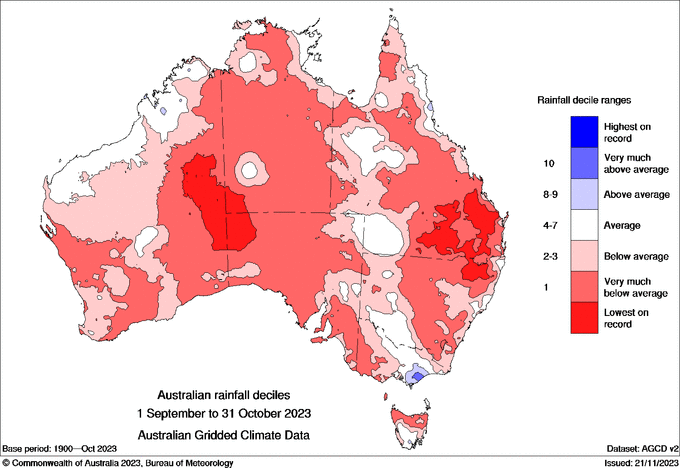
Image: Observed rainfall deciles during September and October 2023 combined. Source: Bureau of Meteorology
By contrast, November has featured widespread rain and thunderstorms over part of every state and territory in Australia. Some areas in Qld, NSW, the NT, SA and WA have already collected more than three times their average November rainfall and there is more wet weather in store for the final days of the month.
Image: Observed rainfall between November 1 and 27, 2023 as a percentage of the November monthly average. Source: Bureau of Meteorology
It is worth pointing out that rainfall this month has been somewhat hit and miss, with some places seeing heavy falls and others missing out. One place that has found themselves under plenty of precipitation is Nyngan Airport in NSW, which has seen 118 mm of rain so far this month, making this its 6th wettest November in records dating back to 1879.
This sudden shift from dry to wet weather in November highlights that El Niño is not the only factor influencing Australia’s weather.
While broad-scale climate drivers like El Niño and the Indian Ocean Dipole influence seasonal patterns of rainfall and temperature in Australia, individual weather systems are controlled by jet streams.
The term jet stream refers to a current of very fast-moving air that flows near the top of the troposphere, roughly 10 to 15km above sea level. There are two jet streams in each hemisphere, and they mostly flow from west to east. The strength and shape of the jet streams affects the movement of high and low pressure systems near Earth’s surface.
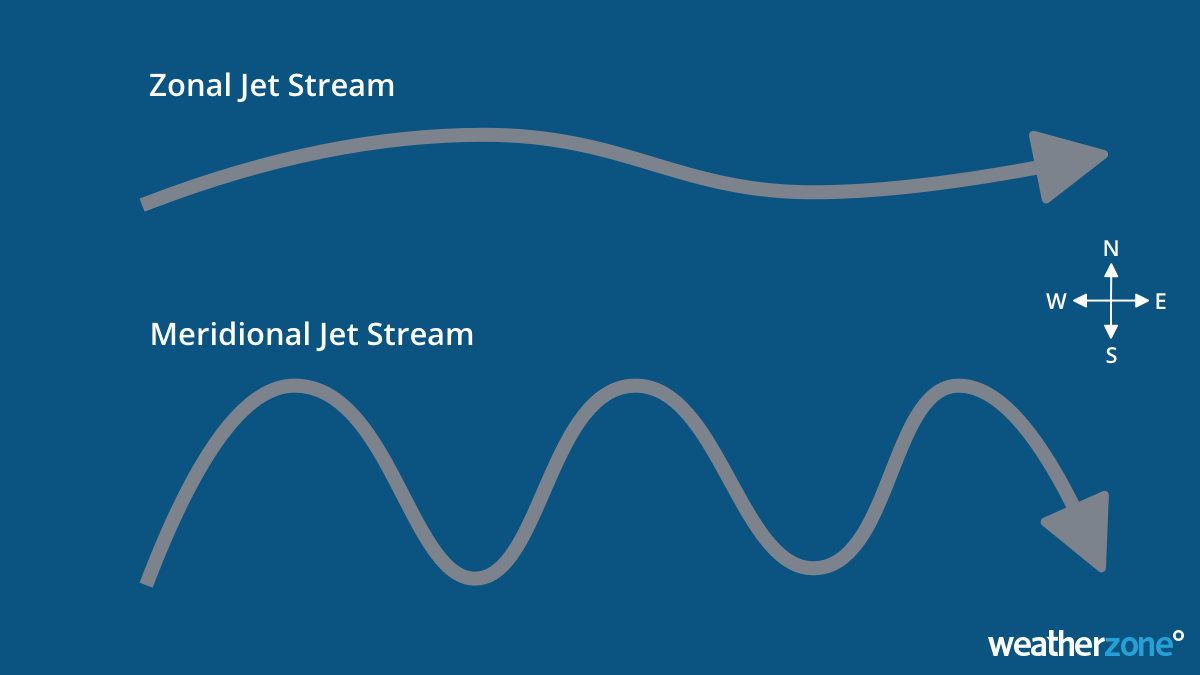
Meteorologists broadly classify the jet streams as being in a ‘zonal’ or ‘meridional’ pattern:
- A zonal jet stream pattern occurs when a jet flows from west to east without meandering much.
- A meridional pattern occurs when a jet stream meanders and has sections flowing from south to north and then bending around to flow from north to south
Weather systems near the ground tend to be more transient under the influence of a zonal jet stream, often causing their weather impacts to be short-lived for any one location.
By contrast, meridional jet streams can cause weather pattern to stagnate and produce adverse weather over a more prolonged period. Meridional patterns are often responsible for temperature and rainfall extremes.
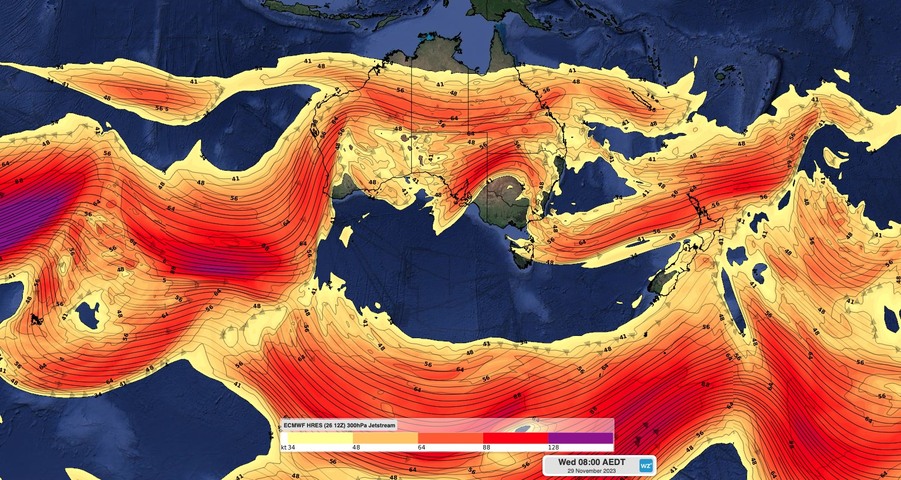
The jet stream is currently in a meridional pattern over Australian longitudes, which is leading to a stagnant weather pattern that will produce a lengthy spell of rain and thunderstorms over the country’s east and southeast this week. This meandering jet stream pattern was also responsible for the heatwave conditions that affected the southwest of WA earlier this month.
Image: Modelled position of the 500 hPa pressure surface at two different elevations over the Southern Hemisphere. The meandering yellow/red line near Australia and New Zealand reveals a meridional long wave pattern that is associated with this week’s wet and stormy weather. Source: NOAA/PSL
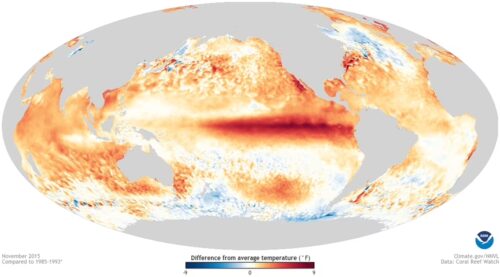
In addition to the slow-moving weather pattern over Australia, above average sea surface temperatures near the continent have been providing fuel for this month’s rain and thunderstorms.
Weatherzone is here to help this summer and wet season. For more information please contact us at apac.sales@dtn.com.